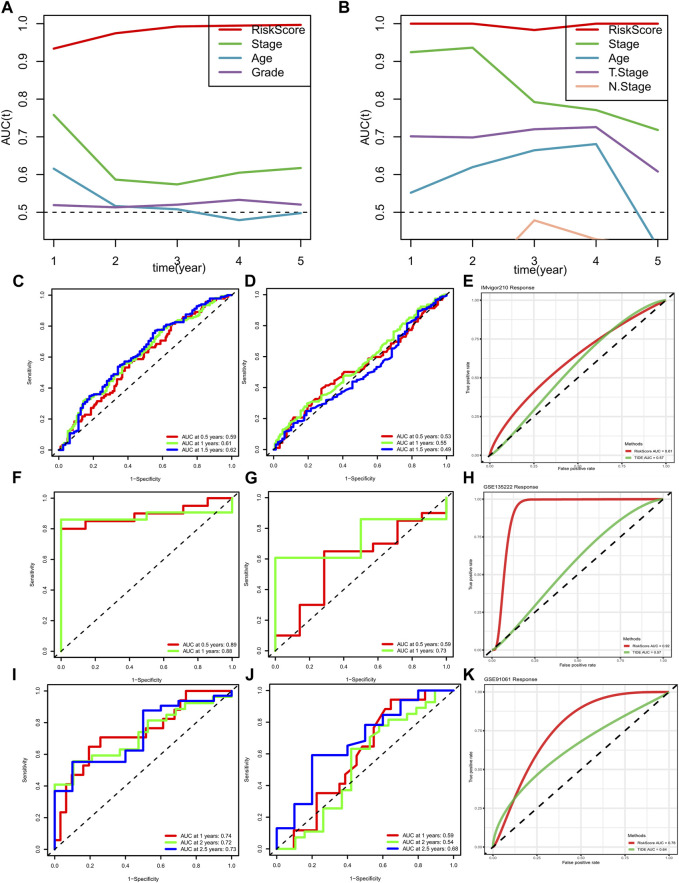
FIGURE 10.
METABRIC and TCGA risk scores compared with AUCs during 1–5 years of clinical characteristics (A, B); ROC curve of risk score of GSE91061 dataset (C); ROC curve of TIDE predicted immunotherapy response in data set GSE91061 (D); ROC curve of risk score and TIDE effect on immunotherapy in dataset GSE91061 (E); ROC curve of risk score of GSE135222 dataset (F); ROC curve of TIDE predicted immunotherapy response in data set GSE135222 (G); ROC curve of risk score and TIDE response to immunotherapy in dataset GSE135222 (H); ROC curve of risk score of data set IMvigor210 (I); ROC curve of TIDE predicted immunotherapy response in the data set IMvigor210 (J); ROC curve of risk score and TIDE effect on immunotherapy in data set IMvigor210 (K).

