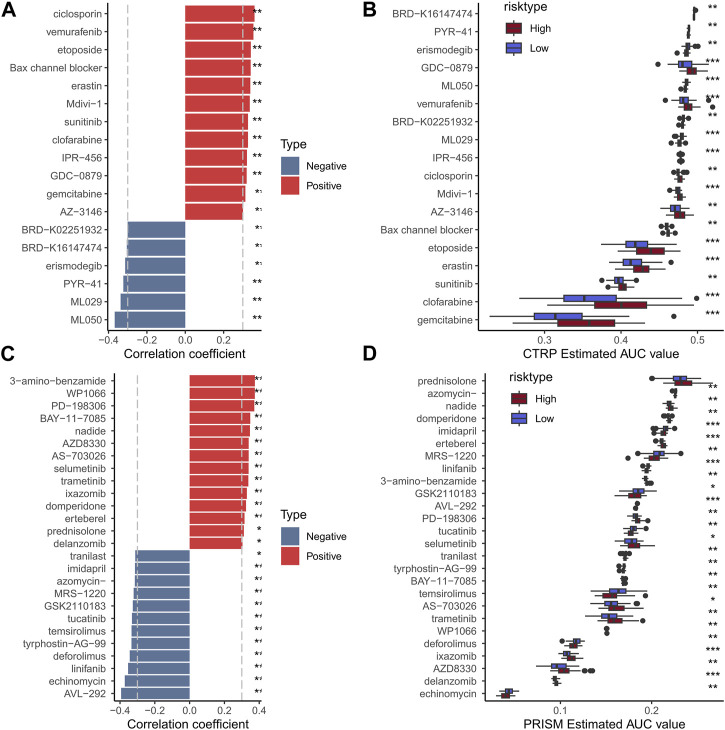
FIGURE 11.
Histogram and boxplot of drug susceptibility predicted by CTRP algorithm and the absolute value of risk score correlation greater than 0.3 (A, B); Histogram and boxplot of drugs with absolute value of correlation between drug sensitivity predicted by PRISM algorithm and risk score greater than 0.3 (C, D).

