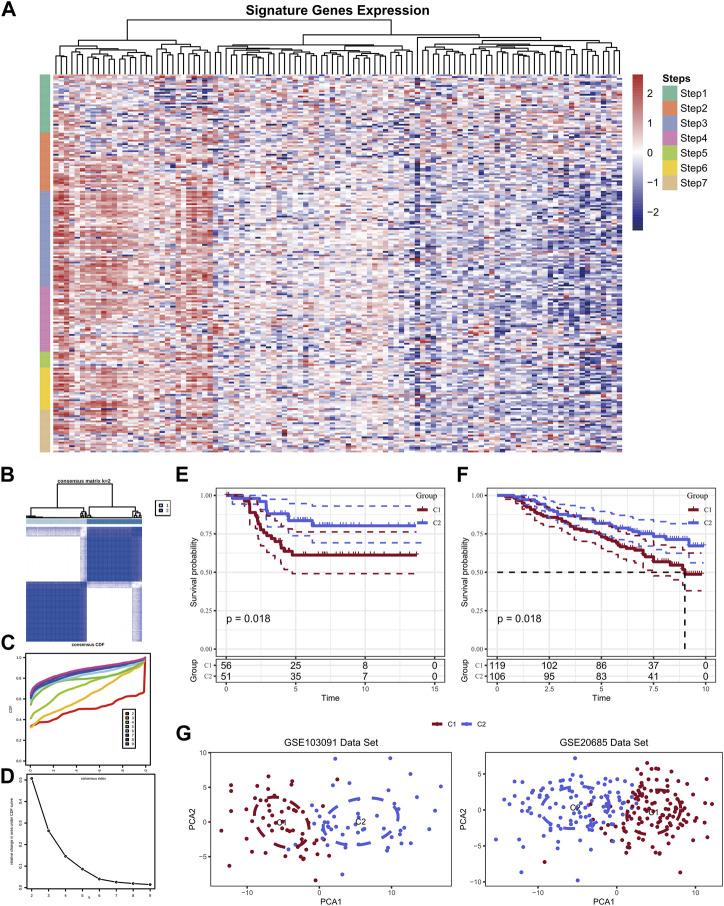
FIGURE 2.
Expression of TIP-related genes in the GSE103091 dataset (A); Sample clustering heat map when consensus k = 2 (B); CDF curve of GSE103091 cohort sample (C); CDF Delta area curve of GSE103091 cohort sample. Delta area curve of consensus clustering, indicating the relative change in area under the cumulative distribution function (CDF) curve for each category number k compared with k-1. The horizontal axis represents the category number k and the vertical axis represents the relative change in area under CDF curve (D); Prognostic relationship between two subtypes of GSE103091 (E) and GSE20685 (F); The two data sets were clustered using PCA (G).

