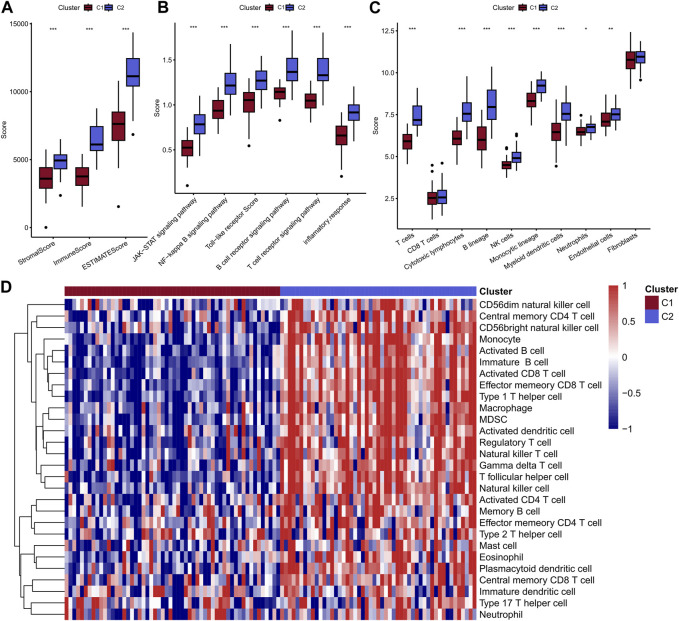
FIGURE 3.
Comparison of immune scores of two molecular subtypes (A); Comparison of scores of 6 inflammatory pathways (B); MCPcounter calculated the abundance scores of 8 immune cells compared with 2 stromal cells (C); ssGSEA calculated the scores of 28 immune cells, and the results were presented in heat maps of the two subtypes (D).

