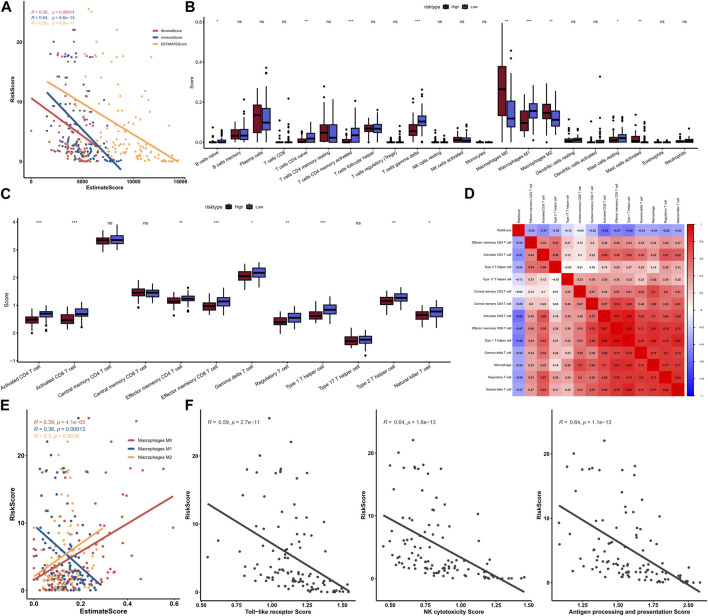
FIGURE 8.
Correlation between risk score and immunity score (A); The scores of immune cells in the high-low risk group in the 22 calculated by CIBERSORT (B); Comparison of T cell scores in high and low risk groups (C); Heat map of correlation between risk score and T cells (D); Correlation graph between three types of macrophages and risk score (E); Correlation between three macrophage-related pathway scores and risk scores (F).

