
Figure 4.
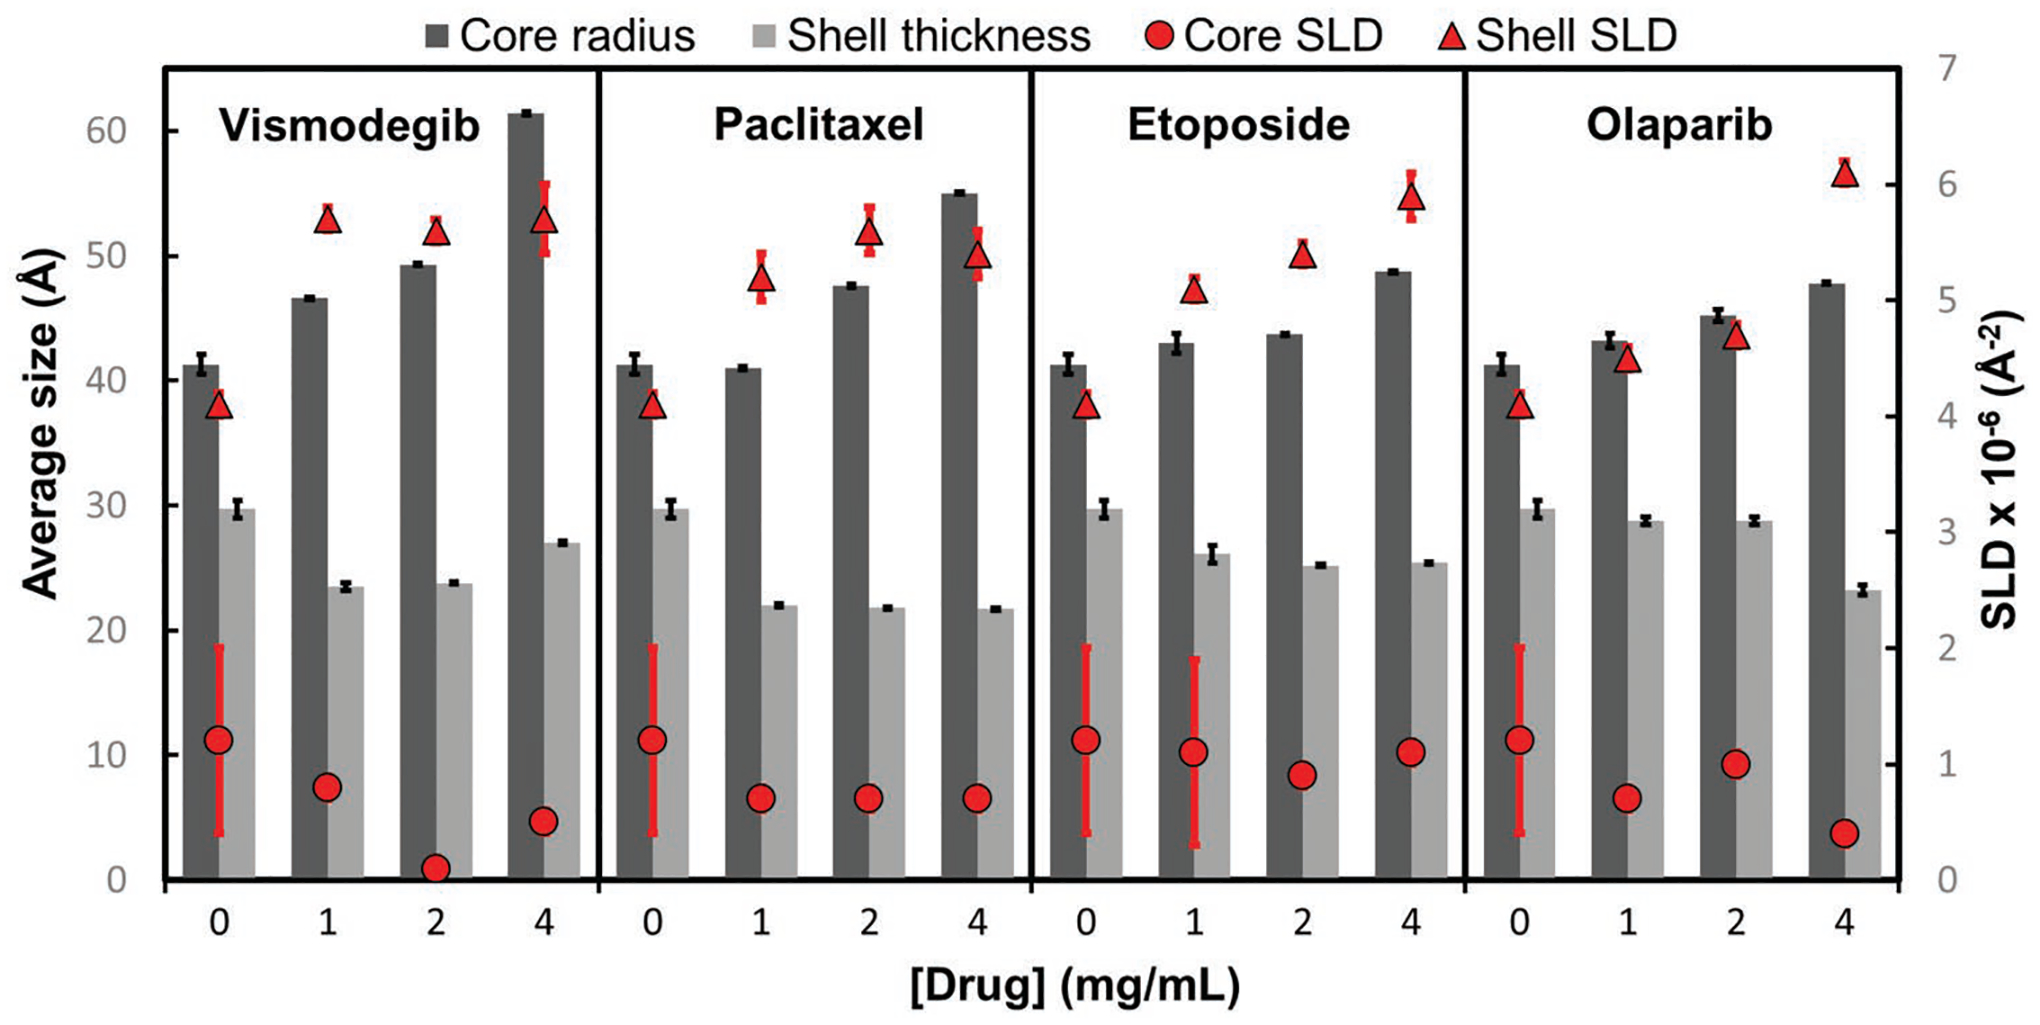
Fitted parameters for SANS data of T2 micelles in the presence of various drug concentrations. The dark grey bars represent the average core radius of the micelles in the sample, the light gray bars show the average shell thickness, red circles show the micelle core SLD, and red squares show the shell SLD. For comparison, the calculated neutron SLD for pure drug solutions in 100% D2O are: 2.929 × 10⁻⁶ Å−2 for Etoposide (d = 1.6 g cm−3), 2.797 × 10⁻⁶ Å−2 for olaparib (d = 1.4 g cm−3), 2.694 × 10⁻⁶ Å−2 for paclitaxel (d = 1.4 g cm−3), and 2.845 × 10⁻⁶ Å−2 for vismodegib (d = 1.4 g cm−3). Error bars correspond to one standard deviation of uncertainty.