
Figure 5.
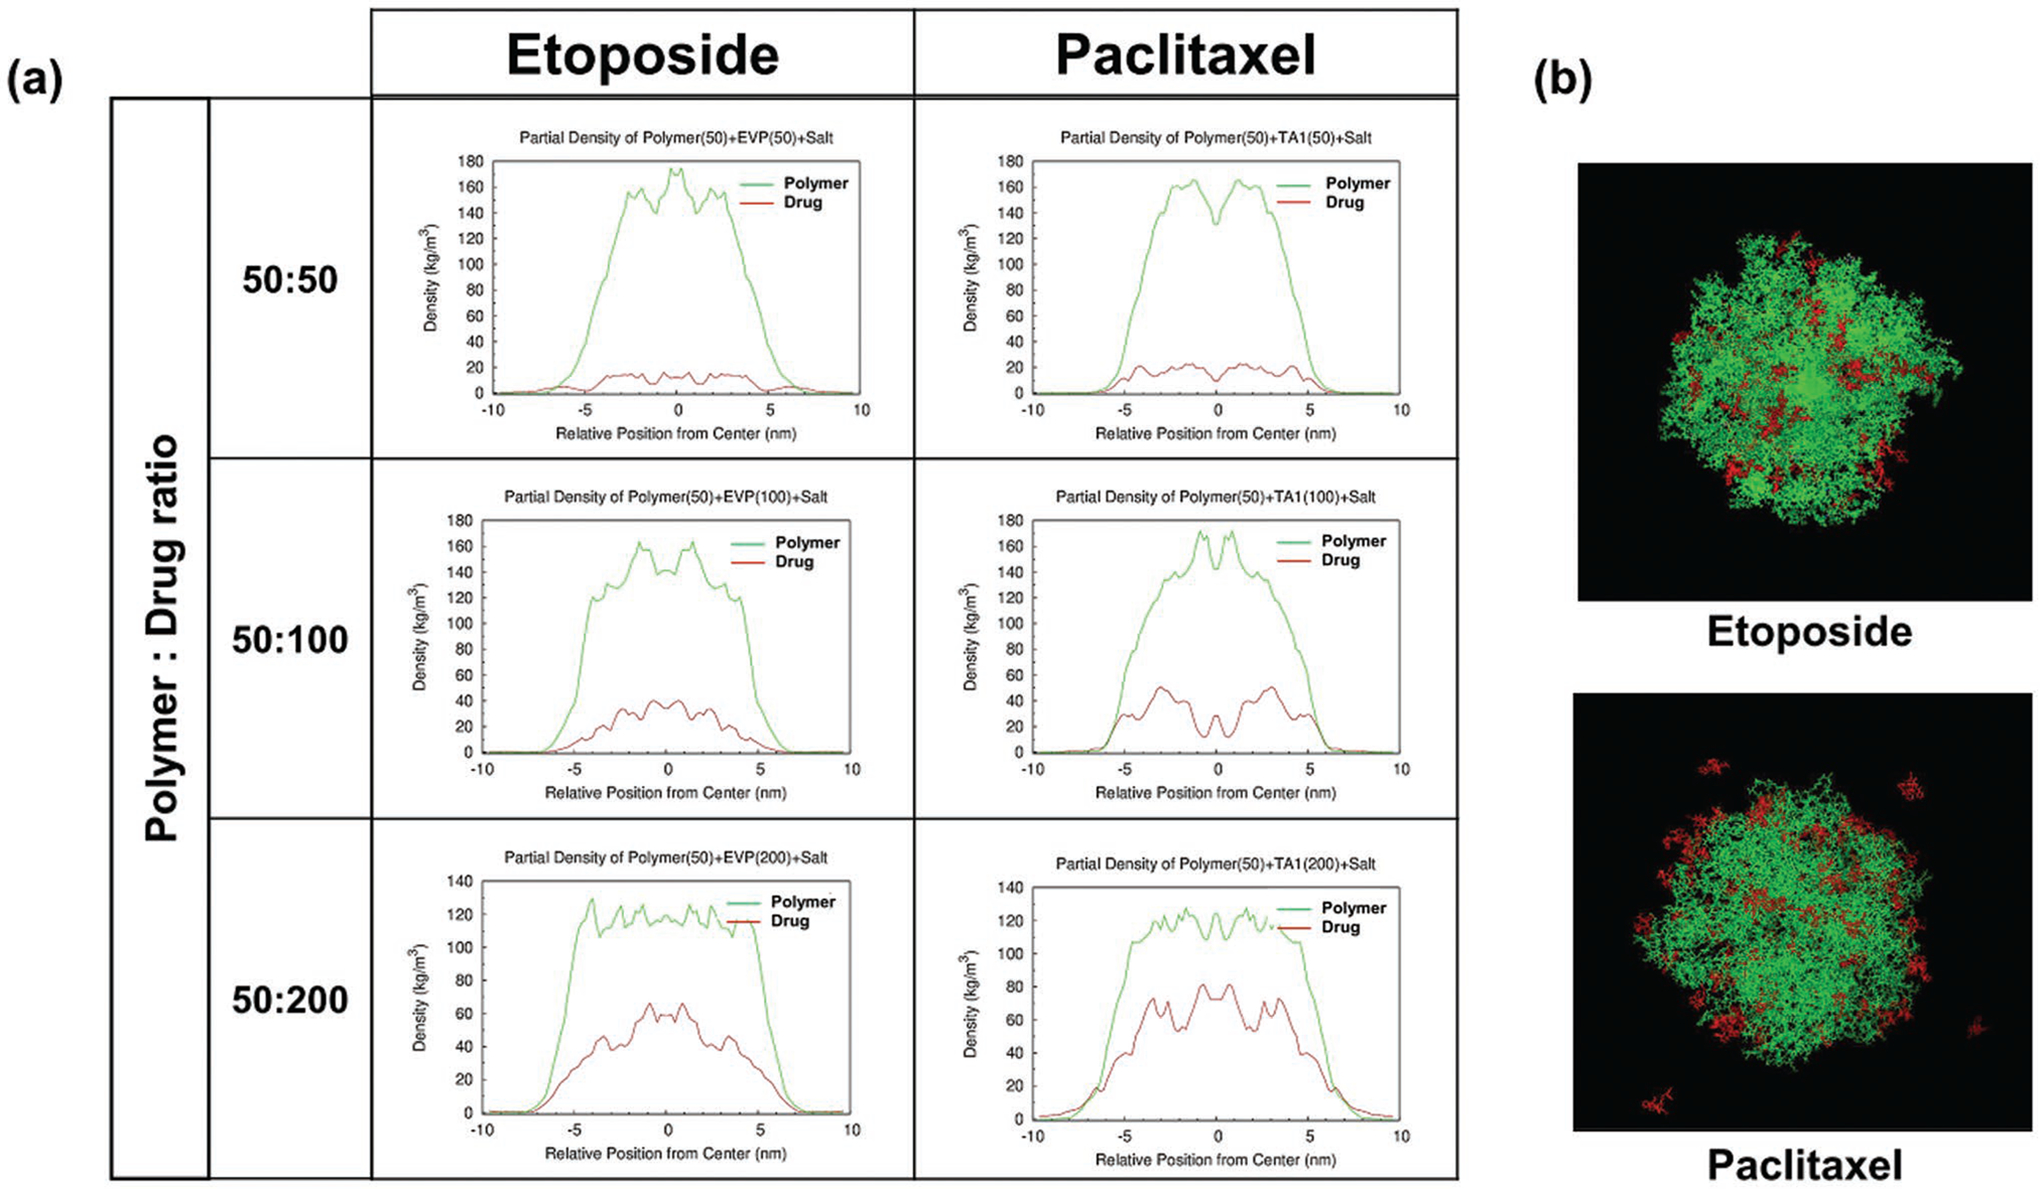
MD simulation of etoposide and paclitaxel in T2 micelles: a) the drug (red) and polymer (green) density profiles from the center of the micelles, and b) simulated snapshots of the drug-loaded micelles. The 50 polymer chains and 50, 100, and 200 drug molecules were simulated for a total of 100 ns.