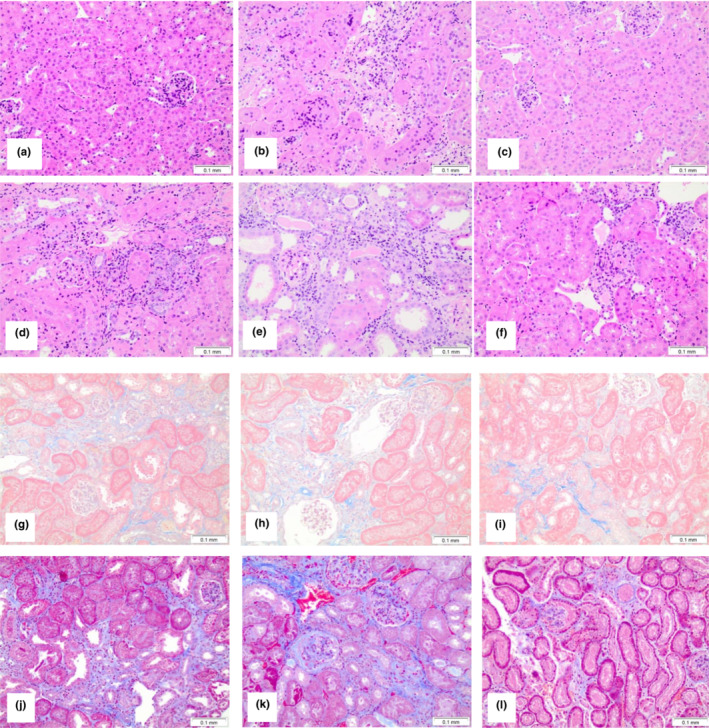
FIGURE 4.

Histologic changes in mice treated with warfarin and N‐acetylcysteine (NAC). Representative images from the kidneys obtained from mice at 23 weeks after the ablative surgery and treated with warfarin or warfarin and NAC. (a, g) Control 5/6NE C57BL/6 mice; (b, h) 5/6NE C57BL/6 mice treated with warfarin 1.0 mg/kg/day; (c, i) 5/6NE C57BL/6 mice treated with warfarin 1.0 mg/kg/day and NAC 30 mg/kg/day. (d, j) control 5/6NE 129S1/SvImJ mice; (e, k) 5/6NE 129S1/SvImJ mice treated with warfarin 0.5 mg/kg/day; (f, l) 5/6NE 129S1/SvImJ mice treated with warfarin 0.5 mg/kg/day and NAC 30 mg/kg/day. (a–f) Hematoxylin and Eosin stain, (d–l) Masson's trichrome stain. Magnification 200×.
