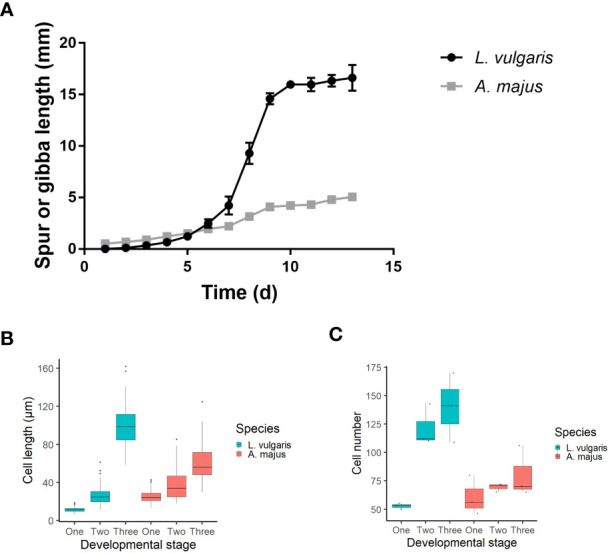
Figure 2.

(A) A timecourse of spur and gibba growth. Anthesis occurred on day 10. Spur growth initiates later and has a higher growth rate than the gibba. The mean of five biological replicates is shown, +/- SE. (B, C) A comparison between cell length and number between the developing spur and gibba. The mean is shown +/-SE. (B) Cell length comparison between A. majus and L. vulgaris. Three biological replicates were taken for each species, with 30 replicates taken for each biological replicate. Cells were measured at the base of the spur/gibba. Data visualised using a boxplot; midpoint on boxplot indicates median, lines indicate the first and third quartiles. Outliers are indicated with dots. (C) Cell number comparison between the gibba of A. majus and the spur of L. vulgaris. Cells were counted along a single line from base to tip of the spur/gibba. Data visualised using a boxplot; midpoint on boxplot indicates median, lines indicate the first and third quartiles. Data from three replicates for each species are plotted on the boxplot.
