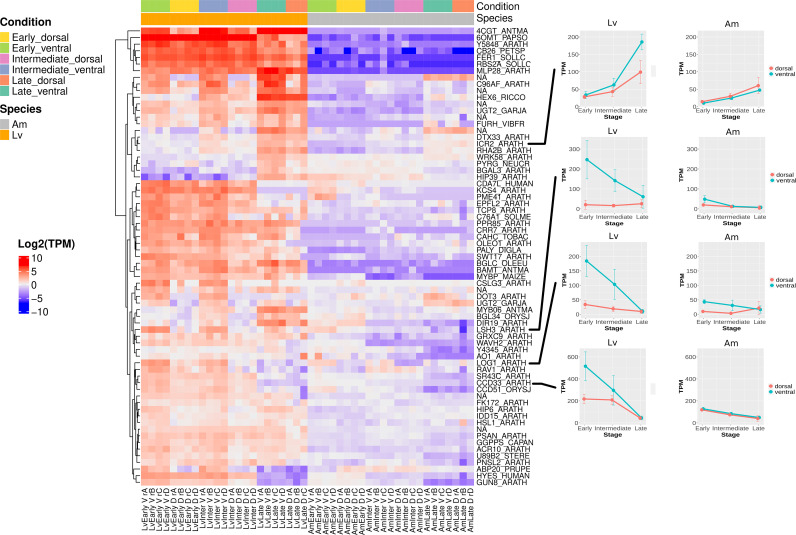
Figure 4.
Heatmap showing the spur aid genes at all developmental stages in L. vulgaris and A. majus. Spur aid genes were clustered based on expression pattern. For each spur aid gene (see methods), raw read counts were transformed using transcripts per million (TPM) and then normalised by subtracting the median TPM across all samples (including both species) for each gene. Each row represents a gene, and each column a sample. Red indicates above the average, and blue indicates below average. Expression patterns of spur aid genes highlighted in text are shown on right hand side of heatmap.

