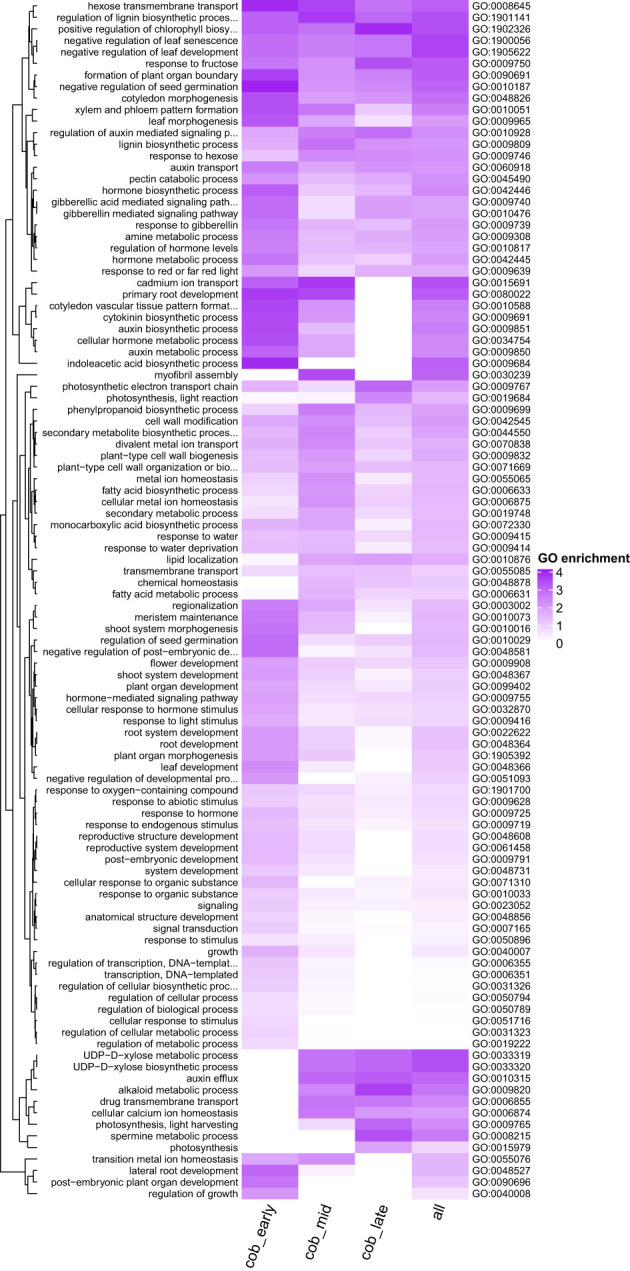
Figure 5.

Heatmap shows GO terms for biological process that are enriched in spur genes (see methods) across different developmental stages. P value cutoff is < 0.005 and the node size is 5 for visualisation purposes. Each row represents a GO term, and each column a gene set. cob_early = both spur aid and suppressor genes at the early stage, cob_mid = both spur aid and suppressor genes at the intermediate stage, cob_late = both spur aid and suppressor genes at the late stage and all = spur aid and suppressor genes from all three developmental stages. Dark purple indicates a higher level of enrichment.
