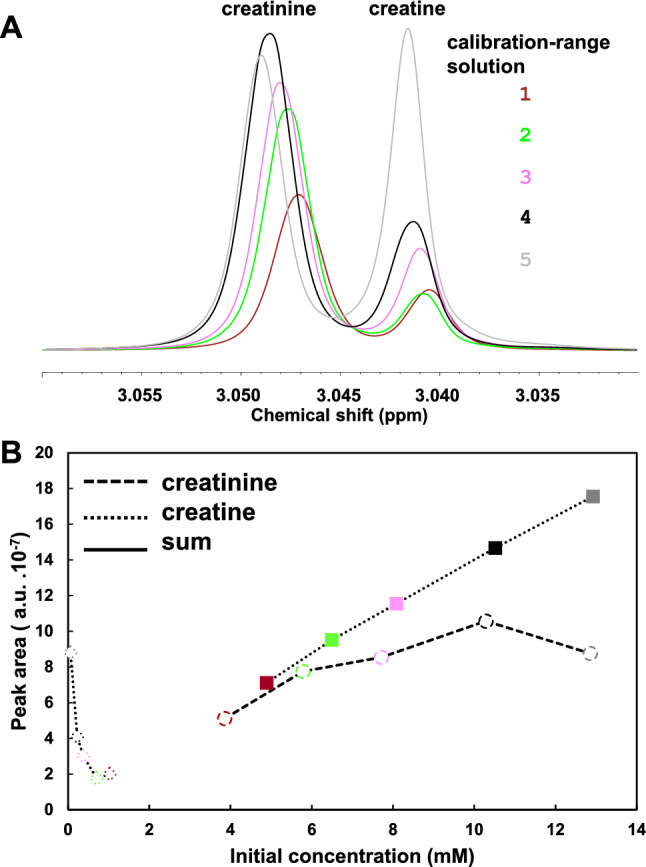
Fig. 3.

Creatine and creatinine resonances in zgpr spectra and peak areas for five calibration range solutions. A Zoom-in on creatinine and creatine spectra region. B Plot of corresponding peak areas as a function of concentrations in synthetic urine solution. Ordinates: peak areas of creatine (open diamonds) and creatinine (open circles) resonances determined by one operator using peak integration with TopSpin (PI1), and of their sum (full squares). Abscissa: theoretical concentrations in synthetic urine at time of its preparation, i.e. “initial concentration”. a.u. arbitrary units
