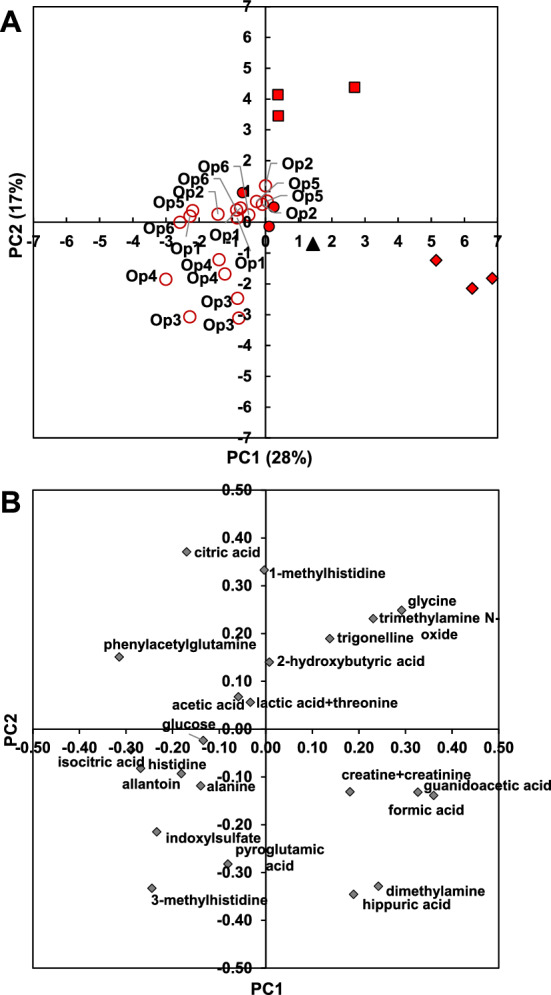
Fig. 4.

PCA of quantification data of 20 metabolites and two sums of two metabolites of synthetic urine quantified in zgpr spectra with external calibration. A Scores plot. Open circle, peak integration with TopSpin (PI1-ExtCal); closed circle, peak integration with NMRProcFlow (PI2-ExtCal); diamond, deconvolution with Mnova (DC1-ExtCal); square, deconvolution with NMRDeconvR (DC2-ExtCal); triangle, plot of theoretical sample. For peak integration with TopSpin performed by six operators, operator is annotated. B Loadings plot with metabolite annotation
