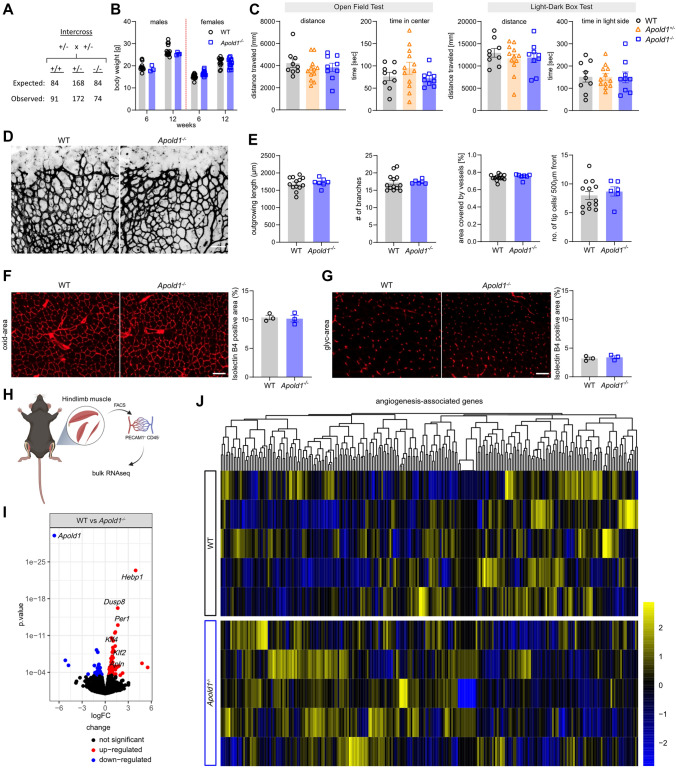
Fig. 2.
Apold1 deficiency does not affect physiological angiogenesis A Expected and observed Mendelian distribution of heterozygous breedings (Chi-square test: 0.9585; p = 0.6193). B Quantification of body weight at 6 and 12 weeks of age in females and males between genotypes (n = 3–14 per group). C Behavioral analysis of WT and Apold1−/− in the open-field test and light–dark box measured by distance traveled and time in center/time in light side (n (WT/Apold1±/Apold1−/−) = 9/12/9). D Representative images of isolectin-B4-stained (black) retinal vessels of postnatal day 5 (P5) pups. Scale bar, 100 µm. E Quantification of outgrowing vessel length, number of branches, percentage of area covered by vessels, and number of tip cells in 500 µm front of the retina (n (WT/Apold1−/−) = 13/6). F Representative images and percentage positive area of blood vessels stained with isolectin B4 (red) in the oxidative area of the gastrocnemius (oxid-area) (n (WT/Apold1−/−) = 3/3). Scale bar, 200 μm. G Representative images and percentage of positive area of blood vessels stained with isolectin B4 in the glycolytic area of the gastrocnemius (glyc-area) (n (WT/Apold1−/−) = 3/3). Scale bar 200 µm. H Experimental design. I Volcano plot of significantly differentially expressed genes by bulk RNAseq of WT vs Apold1−/− mECs (n (WT/Apold1−/−) = 5/5). J RNA expression heat map of all angiogenesis-associated genes (n(WT/Apold1−/−) = 5/5). Student’s test in B, E, F, and G; one-way ANOVA with Tukey’s multiple comparison test in C. The data shown are mean ± SEM

