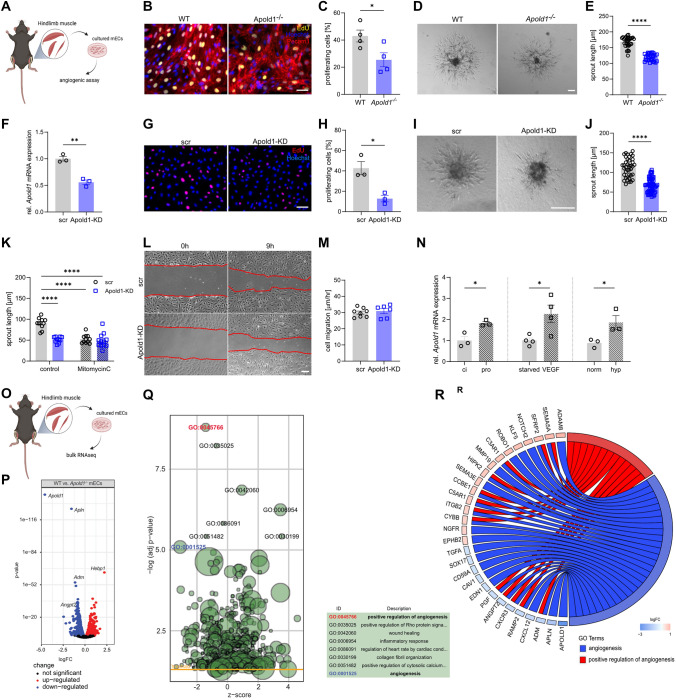
Fig. 6.
Angiogenesis is impaired in Apold1-deficient cells in vitro. A Experimental design. B, C Representative immunofluorescent images and quantification of four independent experiments of EdU (yellow) labeling of proliferating ECs isolated from skeletal muscle of WT and Apold1−/− mice, co-stained with Hoechst (blue) (n (WT/Apold1−/−) = 4/4. Scale bar, 100 μm). D, E Representative bright-field images and morphometric quantification of average sprout length of sprouting spheroids of mECs isolated from WT and Apold1−/− mice (n (WT/Apold1−/−) = 30/33. Scale bar, 100 μm). F Apold1 knockdown efficiency in HUVECs treated with scrambled (scr) shRNAs or shRNAs against Apold1 (Apold1-KD). G, H Representative immunofluorescent images and quantification of percentage of EdU (red)-labeled proliferating HUVECS to all nuclei stained with Hoechst (blue) in scr and Apold1-KD HUVECs (n (WT/Apold1-KD) = 3/3. Scale bar, 100 μm). I, J Representative image and quantification of sprout length of spheroids of scr and Apold1-KD HUVECs (n (scr/Apold1-KD) = 30/33. Scale bar, 100 μm). K Quantification of sprout length in scr and Apold1-KD HUVECs treated in control conditions or Mitomycin C (n (scr/Apold1-KD) = 10/10). L, M Representative images and quantification of cell migration in scratch assay (n (scr/Apold1-KD) = 7/6). N Relative Apold1 expression in contact-inhibited (ci) and proliferative conditions (pro), after VEGF treatment and in hypoxic condition (0.1% O2) (n (scr/Apold1-KD) = 3-4/3-4). O Experimental design. P Volcano plots with red and blue dots showing significantly changed genes within 5% false discovery rate (FDR) determined by bulk RNAseq of cultured WT vs Apold1−/− mECs (n (WT/Apold1−/−) = 3/3). Q Gene ontology analysis of bulk RNAseq of cultured and WT vs Apold1−/− mECs (n (WT/Apold1−/−) = 3/3). R Overview of genes significantly differentially expressed within the GO terms angiogenesis (blue) and positive regulation of angiogenesis (red) in cultured WT and Apold1−/− mECs. Student’s test in C, E, F, H, J, M, and N; Two-way ANOVA with Tukey’s multiple comparison test in K (*p < 0.05; **p < 0.01; ****p < 0.0001). The data shown are mean ± SEM

