
Figure 1.
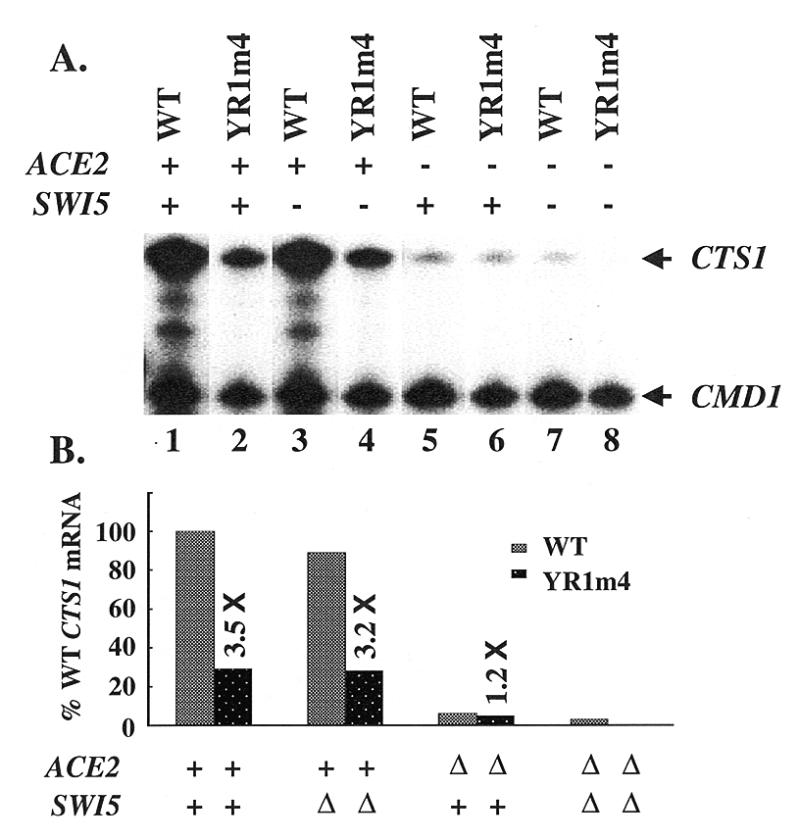
The expression of endogenous CTS1 gene is decreased in YR1m4 cells. (A) S1 nuclease protection analysis of mRNA isolated from isogenic yeast strains that contain either wild-type TFIIB or YR1m4 and differ at ACE2 and SWI5. CMD1 was used as an internal control (31). (B) Relative CTS1 mRNA levels. Activities shown were quantitated by ImageQuant v1.2 and normalized with the CMD1 level. The values are 100, 29, 89, 28, 6, 5, 3, 0.3 in columns 1–8, respectively.