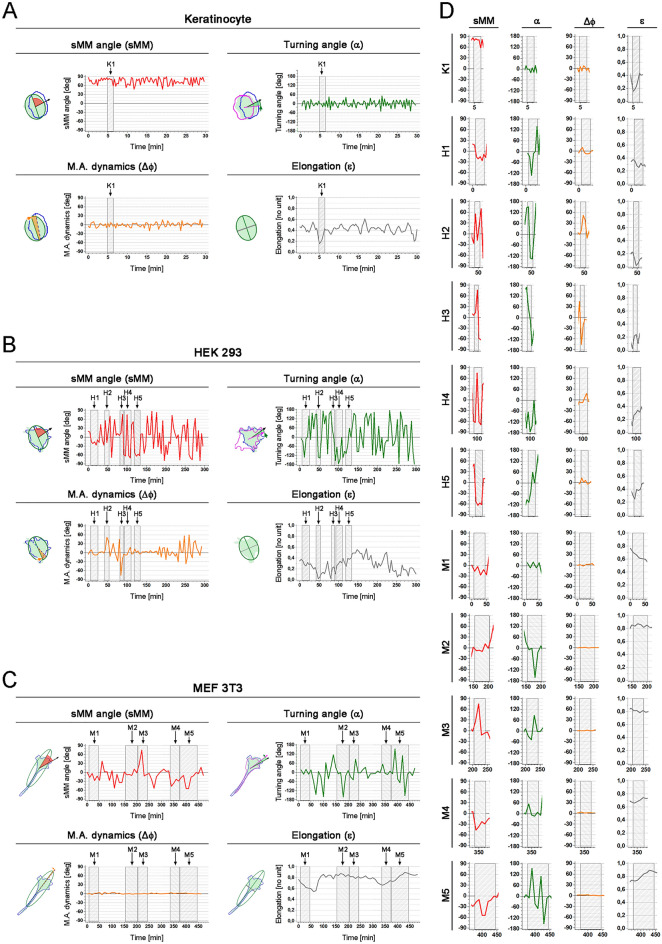
Figure 3.
Time evolution of morphomigrational parameters. (A) Time sequences of sMM angle, turning angle, M.A. dynamics and elongation calculated for single keratinocyte. Fragment K1 for each parameter is analysed in Table 2. (B) Time sequences of sMM angle, turning angle, M.A. dynamics and elongation calculated for single HEK293 epithelial cell. Fragments H1-H5 for each parameter are analysed in Table 2. (C) Time sequences of sMM angle, turning angle, M.A. dynamics and elongation calculated for single MEF 3T3 fibroblast. Fragments M1-M5 for each parameter are analysed in Table 3. (D) Zoomed fragments of analysed fragments: K1, H1–H1 and M1–M5.

