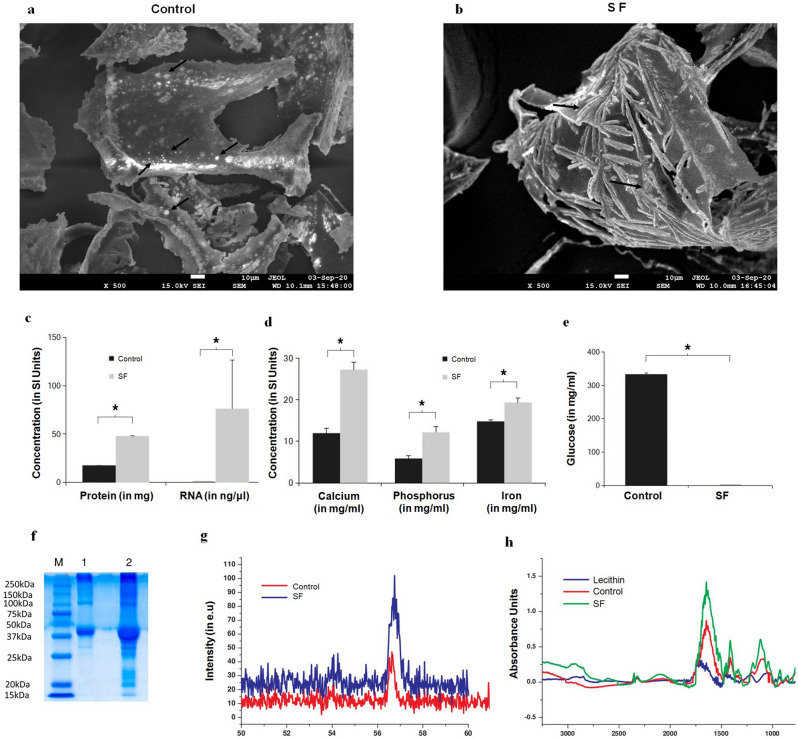
Figure 1.
Characterization of freeze dried adipose derived stem cell secretome. (a) FESEM image of freeze dried medium alone (that is without secretome), black arrows shows crystalline particles, (b) FESEM image of freeze dried secretome, black arrows shows acicular crystalline flakes suggesting protein and/or RNA content in SF; (c) Graphical plots of protein (n = 3) and RNA (n = 3) quantified showing higher concentrations of proteins, and also higher levels of RNA in SF; (d) Graphical plots of minerals profiled of Calcium, phosphorus and iron again showing increased content in SF, (e) estimated glucose levels showing negligible glucose in SF; (f) Scanned Image of SDS Page (M—Marker proteins, Lane 1—control and Lane 2—freeze dried secretome) confirming more numerous and higher protein content in SF compared to control; (g) Graphical plots of XRD analysis with the main peak confirming higher mineral content. (h) Graphical plots of FTIR analysis, with the peaks indicating higher lipid levels in SF. All graphical plots are mean ± SD values and differences between control and treatment concentrations were considered statistically significant for p value < 0.05 and is represented by (*).

