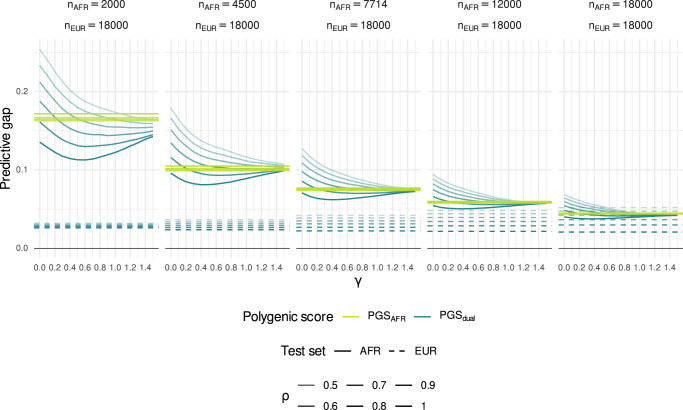
Fig. 2. Simulation study: predictive gap against number of African-ancestry individuals in training set.
Each panel corresponds to a different number of African-ancestry training set individuals from nAFR = 2000 to nAFR = 18,000. The training sets for PGSdual (blue lines) consisted of the corresponding African-ancestry training set for PGSAFR (yellow lines), along with nEUR = 18,000 European-ancestry individuals. Each line represents the mean predictive gap across 50 repetitions. The horizontal dashed lines correspond to the predictive gap for European-ancestry (EUR) test sets based on an unweighted LASSO, while the solid lines correspond to the predictive gap for African-ancestry (AFR) test sets. The parameter γ corresponds to the degree of reweighting used in the reweighted LASSO for PGSdual. The correlation of genetic effects between ancestries ρ was varied from 0.5 (lighter lines) to 1 (darker lines).

