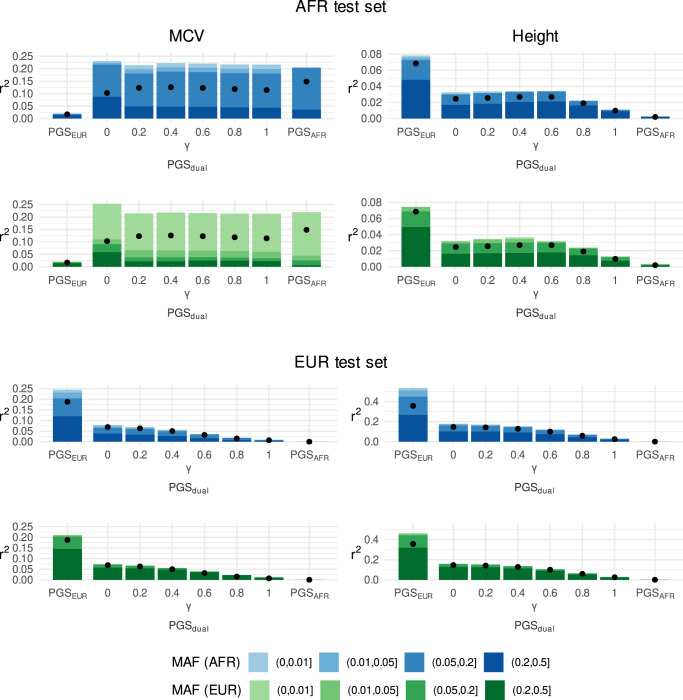
Fig. 6. Allele frequency composition of variance explained by single- and dual-ancestry PGS.
Results shown for mean corpuscular volume (left) and height (right) in a African-ancestry test set (AFR; top) and a European-ancestry test set (EUR; bottom). The black dots represent partial r2 for all the variants, i.e. the entire polygenic score. Variants were grouped according to their minor allele frequency (MAF) in African-ancestry individuals (blue palette) or in European-ancestry individuals (green palette). Each bar represents the sum of the partial r2 values for each subset of variants in a given polygenic score. Note that the bars are stacked, and the height of the bar is generally higher than corresponding dot due to LD between variants. The parameter γ corresponds to the degree of reweighting used in the reweighted LASSO for PGSdual.

