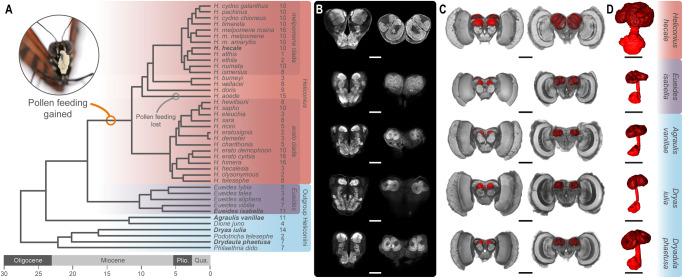
Fig. 1. Variation in absolute mushroom body size across the Heliconiini.
A Dated phylogeny showing the Heliconiini species sampled and the major clades, with the number of individuals sampled for each species shown to the right of the species name. B, C Selected neuroanatomical detail from five species indicated in bold in panel A. B Confocal scans showing the anterior (left) and posterior (right) of the central brain from one representative individual of each species (scale bars = 250 μm). C 3D reconstructions of the whole brain with anterior (left) and posterior (right) views showing the mushroom body (red) (scale bars = 500 μm). D Isolated 3D reconstructions of the mushroom body, showing the calyx (dark red), peduncles and lobes (light red) (scale bars = 250 μm). Source data files: Heliconiini.trees.

