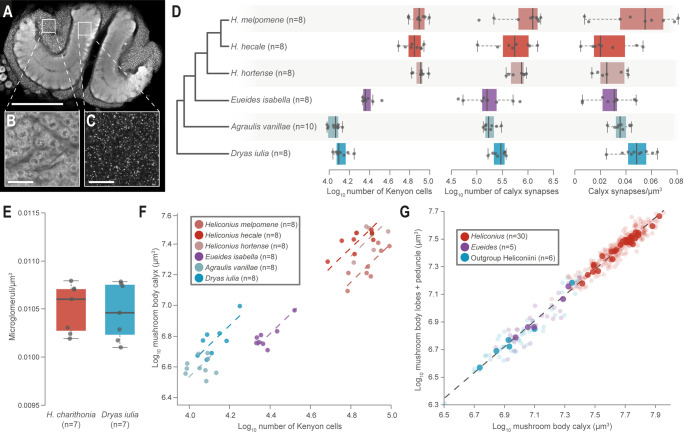
Fig. 3. Increased Kenyon cells and synapses numbers in Heliconius, but conserved cellular scaling.
A Heliconius mushroom body (scale bar = 200 μm), showing (B) the intrinsic neurons, the Kenyon cells (KCs) (scale bar = 50 μm) and (C) synapses (scale bar = 50 μm). D Heliconius show increases in the number of Kenyon cells and synapses, but not synapse density. E Microglomeruli density does not differ between H. charithonia and Dryas iulia. In D and E the box encompasses two middle quartiles, with central line showing median. Whiskers extend to the furthest data point within 1.5 times the interquartile range. F The relationship between calyx volume and KC number varies between species, but not overall between Heliconius and other Heliconiini. G The relationship between the major components of the mushroom body (the calyx and the lobes and peduncle) is conserved across the Heliconiini. Solid points = species means; faded points = individuals. Source data files: D KCdata.csv and Synapsedata.csv; E phalloidin_means.csv; F KCdata.csv; G Heliconiini_neuro_individuals.csv and Heliconiini_neuro_species.csv.

