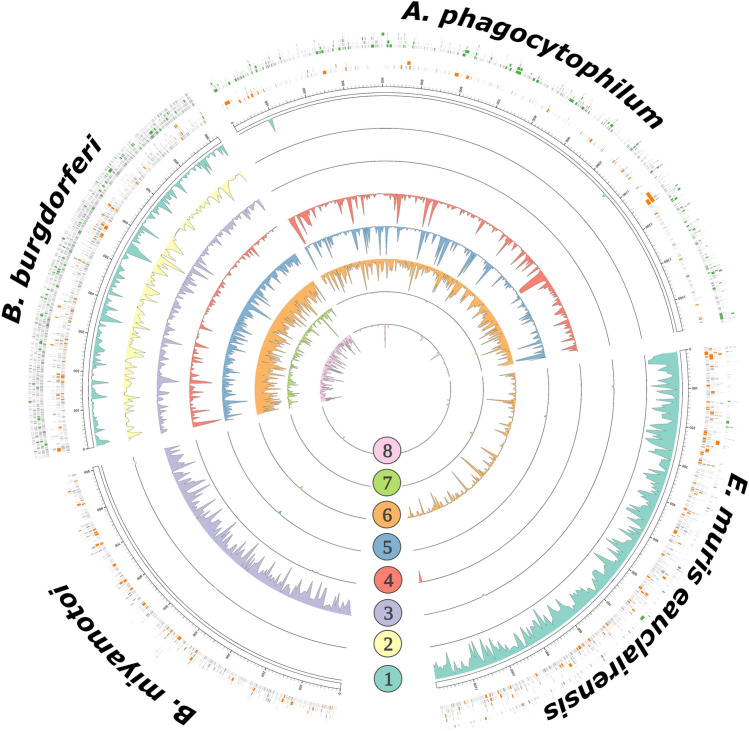
Figure 3.
Recovered metagenomic data generated through NAS by both enrichment and depletion strategies span whole genome assemblies of bacterial tick-borne pathogens. Circos plot depticting complete genomes of four bacterial TBPs: B. burgdorferi s.s., A. phagocytophilum, E. muris eauclairensis, and B. miyamotoi. Outermost bands are individual ONT reads mapping to each bacterial genome. Reads > 2 kb in length generated during NAS enrichment (Tick 1–Tick 4) are visualized in orange, and > 2 kb reads generated during NAS depletion (Tick 5–Tick 8) are shown in green. Inner track histograms depict mean coverage for mapped bases across pathogen genomes for individual tick samples calculated over a sliding widow of 5 kb.

