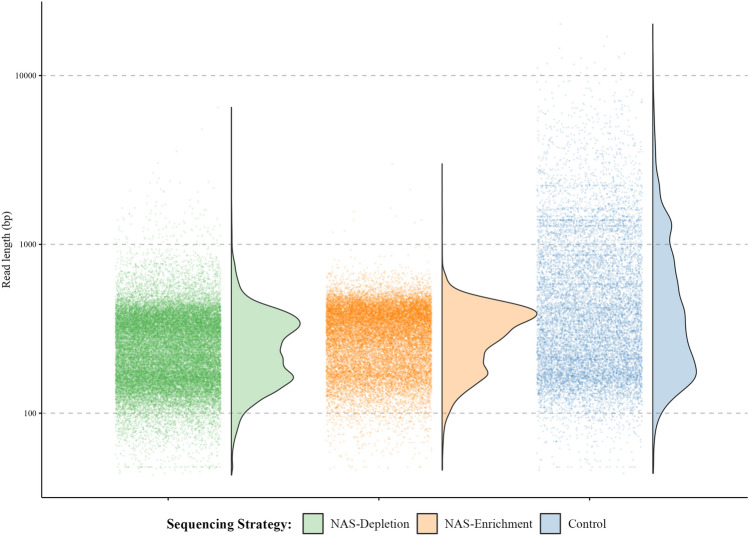
Figure 4.
Distribution of reads mapping against the non-target bacterial I. scapularis endosymbiont, R. buchneri. Total R. buchneri-mapped reads generated over NAS depletion, NAS enrichment, and control sequencing experiments are presented as points by read length over a logarithmic scale. Over both NAS-depletion (green) and NAS-enrichment (orange) sequencing strategies, the read length distribution shows a greater proportion of reads < 1000 bp, indicative of real-time rejection of non-target R. buchneri reads during each sequencing experiment. Conversely, during the control experiment (blue), an increased proportion of reads between 1000–10,000 bp is observed, as all non-target R. buchneri reads present in the library were sequenced fully.

