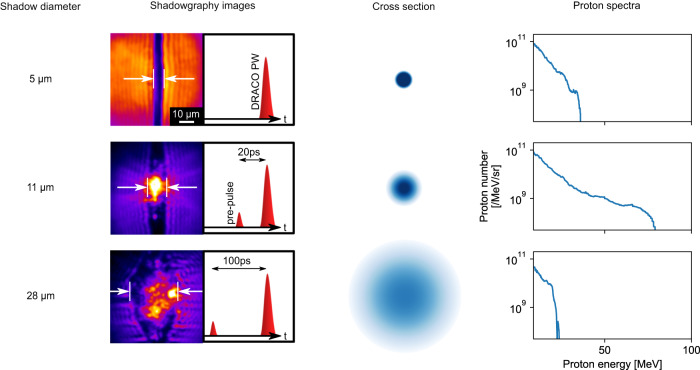
Fig. 2. Measurements of proton energy spectrum.
On-shot shadowgraphy images with the adjacent timing scheme, cross sections visualizing the target density profile and proton energy spectra, as measured by the TPS positioned along the laser propagation direction are shown for different jet pre-expansions (shadow diameter are provided in the left for each case and are indicated by the white arrows in the shadowgraphy images). The rows refer to the shots labeled (1)-(3) in Fig. 3a.

