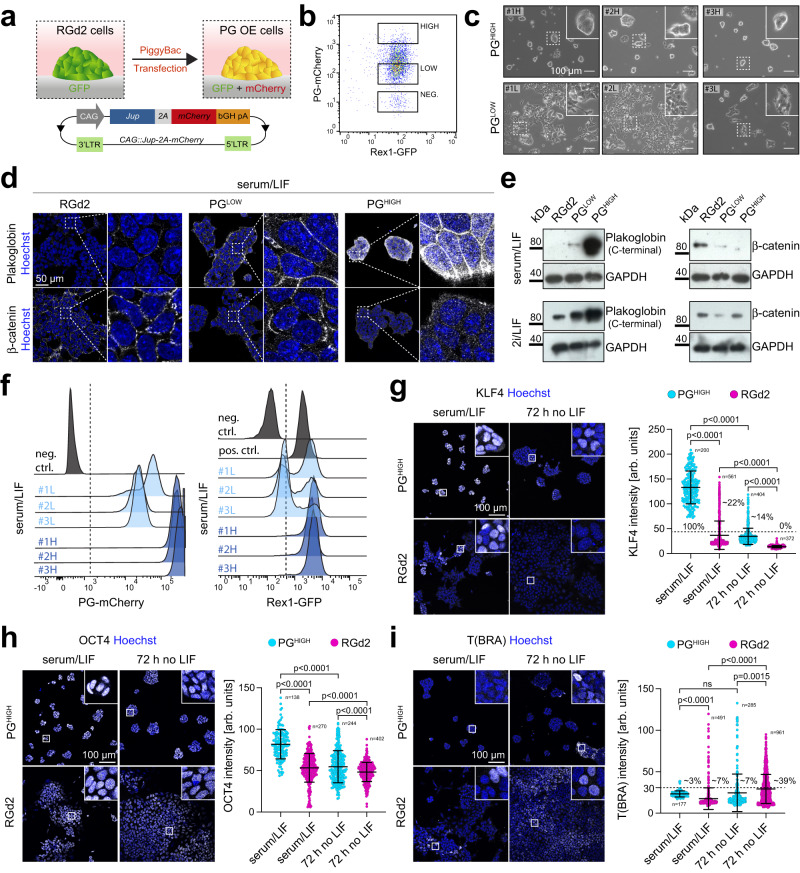
Fig. 5. Plakoglobin expression promotes naive pluripotency in metastable culture conditions.
a Schematic of the generation of Plakoglobin overexpressing RGd2 mESCs (PG OE). Jup (Plakoglobin) expression was placed under the control of a constitutively active CAG promoter and coupled to an mCherry fluorophore via a 2A self-cleaving peptide (CAG::Jup-2 A-mCherry). This cell line simultaneously allowed monitoring of pluripotency via the Rex1-GFPd2 reporter and indicated the level of Plakoglobin via the mCherry signal. bGH pA: bovine growth hormone polyadenylation signal, LTR: long terminal repeats. b Flow cytometric analysis of PG OE mESCs. Single cells were sorted to generate clonal populations of mESCs with high (PGHIGH) or low (PGLOW) levels of Plakoglobin overexpression. c Phase contrast images of clonally expanded PGLOW (#1L, #2L, #3L) and PGHIGH (#1H, #2H, #3H) cells cultured in serum/LIF. Scale bar: 100 µm. Representative images for more than 10 passages. d Confocal immunofluorescence images of RGd2, PGLOW#2, and PGHIGH#3 cells stained for Plakoglobin (PG) and β-catenin. Scale bar: 50 µm. Representative of 3 independent experiments. e Western blot analysis for Plakoglobin and β-catenin in RGd2, PGLOW, and PGHIGH cells in serum/LIF and 2i/LIF. GAPDH was used as loading control. Representative of 3 independent experiments. f Flow cytometric analysis of the established clonal cell lines PGLOW (#1L, #2L, #3L) and PGHIGH (#1H, #2H, #3H) when cultured in serum/LIF. All PGHIGH clones displayed a homogeneous Rex1-GFPd2 signal indicating acquisition of naive-like pluripotent state. g–i Confocal immunofluorescence images of RGd2 and PGHIGH cells cultured in metastable pluripotent (serum/LIF) conditions and after 72 h of LIF withdrawal stained for the naive pluripotency marker KLF4 (g), the general pluripotency marker OCT4 (h), and the mesoderm marker T(BRA) (i). Scale bar: 100 µm. Bottom: Nuclear fluorophore intensity quantification. For KLF4 and T (BRA), positive cells (KLF4 threshold: 45 arb. units; T (BRA) threshold: 30 arb. units) are indicated in [%]. Error bars indicate the mean and standard deviations. p-values were determined by a two-tailed unpaired t-test with Welch’s correction; 3 independent experiments.

