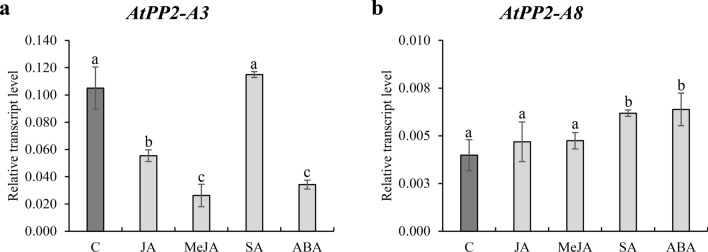
Fig. 2.
Relative expression levels of AtPP2-A3 (a) and AtPP2-A8 (b) genes in uninfected roots of wild-type A. thaliana treated with jasmonic acid (JA), (–)-methyl jasmonate (MeJA), salicylic acid (SA), or abscisic acid (ABA) (24 h treatment with 100 µM concentration each). Bars show mean values ± SD (n = 3). Different letters on bars indicate statistically significant differences according to one-way ANOVA (P < 0.05) and post hoc Fisher’s least significant difference (LSD)

