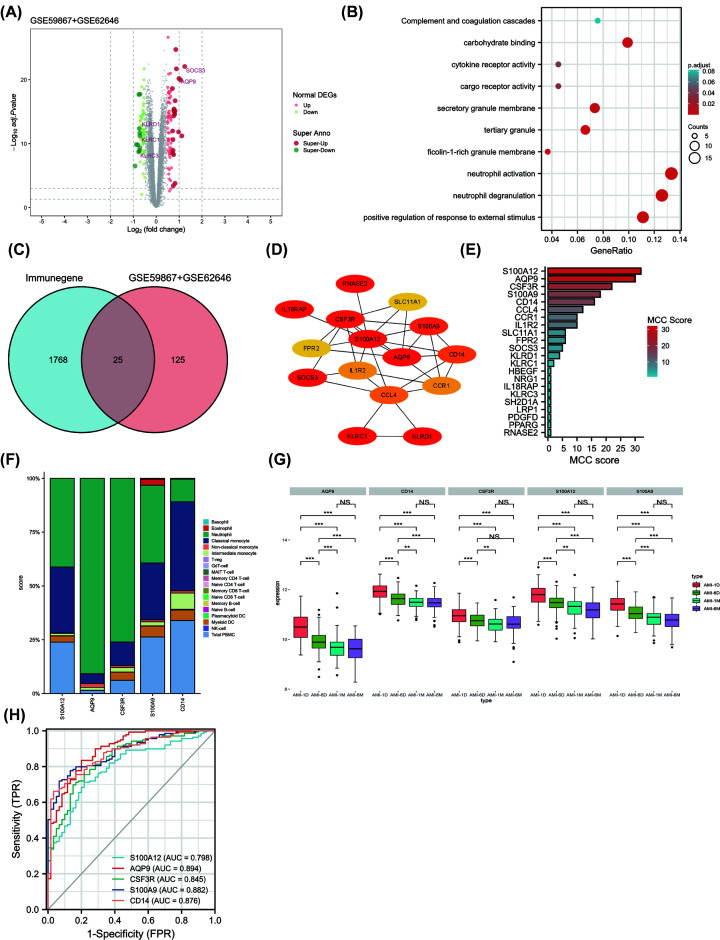
Figure 3. Identification of common immune-related DEGs and predictive performance in merged GSE59867 and GSE62646 datasets.
(A) Differentially expressed genes between acute myocardial infarction and CHD samples in merged dataset (GSE59867+GSE62646). (B) Gene Ontology (GO) enrichment analysis were visualized with bubble plots. (C) The 25 common immune-related DEGs in merged dataset were found by intersecting common DEGs with genes from ImmPort database. (D) PPI network of DEGs using STRING and visualized it using Cytoscape software. (E) MCC (Maximal Clique Centrality) score of the DEGs was visualized with histogram plot. (F) Expression of five hub immune-related DEGs in each type of immune cell by the Human Protein Atlas (HPA) database. We downloaded the expression levels of five genes from the ‘immune cell’ module in HPA database, and showed the gene expression levels at the protein level of each immune cell by percentage histogram. (G) The expression levels of five hub immune-related genes from day 1 to 6 months of PBMC of AMI patients (** means P <0.01, *** means P <0.001). (H) An area under the ROC curve (AUC) of five hub immune-related genes in merged dataset.

