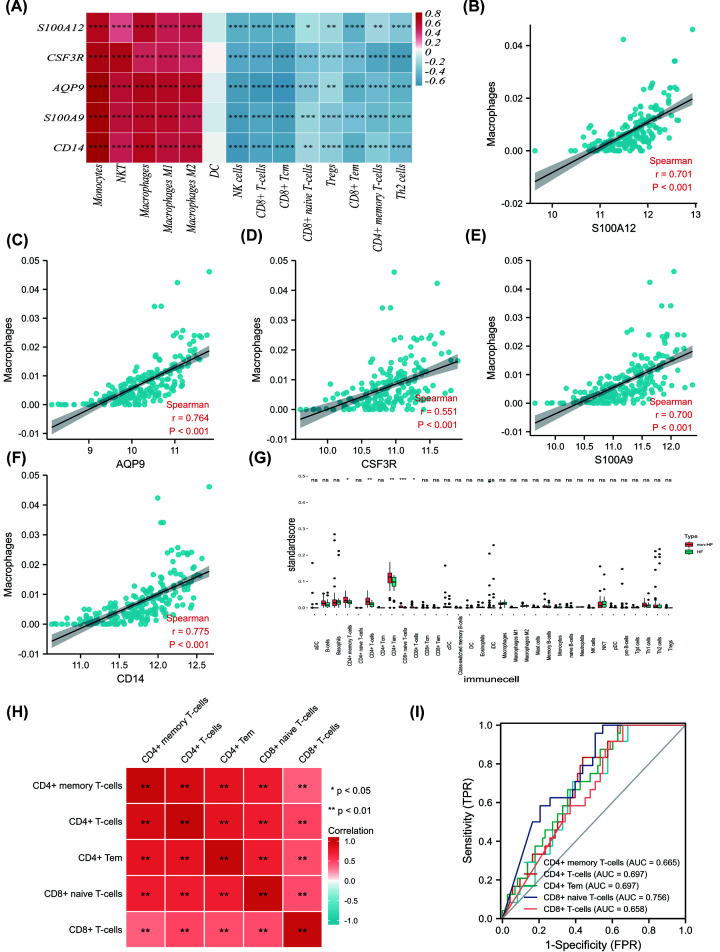
Figure 4. Correlation between the immune-related core DEGs and immune cell infiltration in AMI patients and immune cell landscape between non-HF and post-AMI HF patients after merging datasets (GSE11947 and GSE123342).
(A) Correlation between the immune-related hub DEGs and immune cell infiltration score in merged dataset was visualized with heatmap. immune cell infiltration score was gained by xCell algorithm above. (B–F) Correlation between five hub immune-related genes (S100A12, AQP9, CSF3R, S100A9, and CD14) and macrophage cell infiltration proportion gained by xCell algorithm above. (G) The differences in immune cell abundance between the non-HF and HF group in merged dataset (GSE11947 and GSE123342) by using xCell algorithm (* means P<0.05, ** means P<0.01, *** means P<0.001, **** means P<0.0001). (H) Correlation between five significantly changed immune cell was visualized with a heatmap (* means P<0.05, ** means P<0.01). (I) An area under the ROC curve (AUC) of five immune cell abundance in merged dataset.

