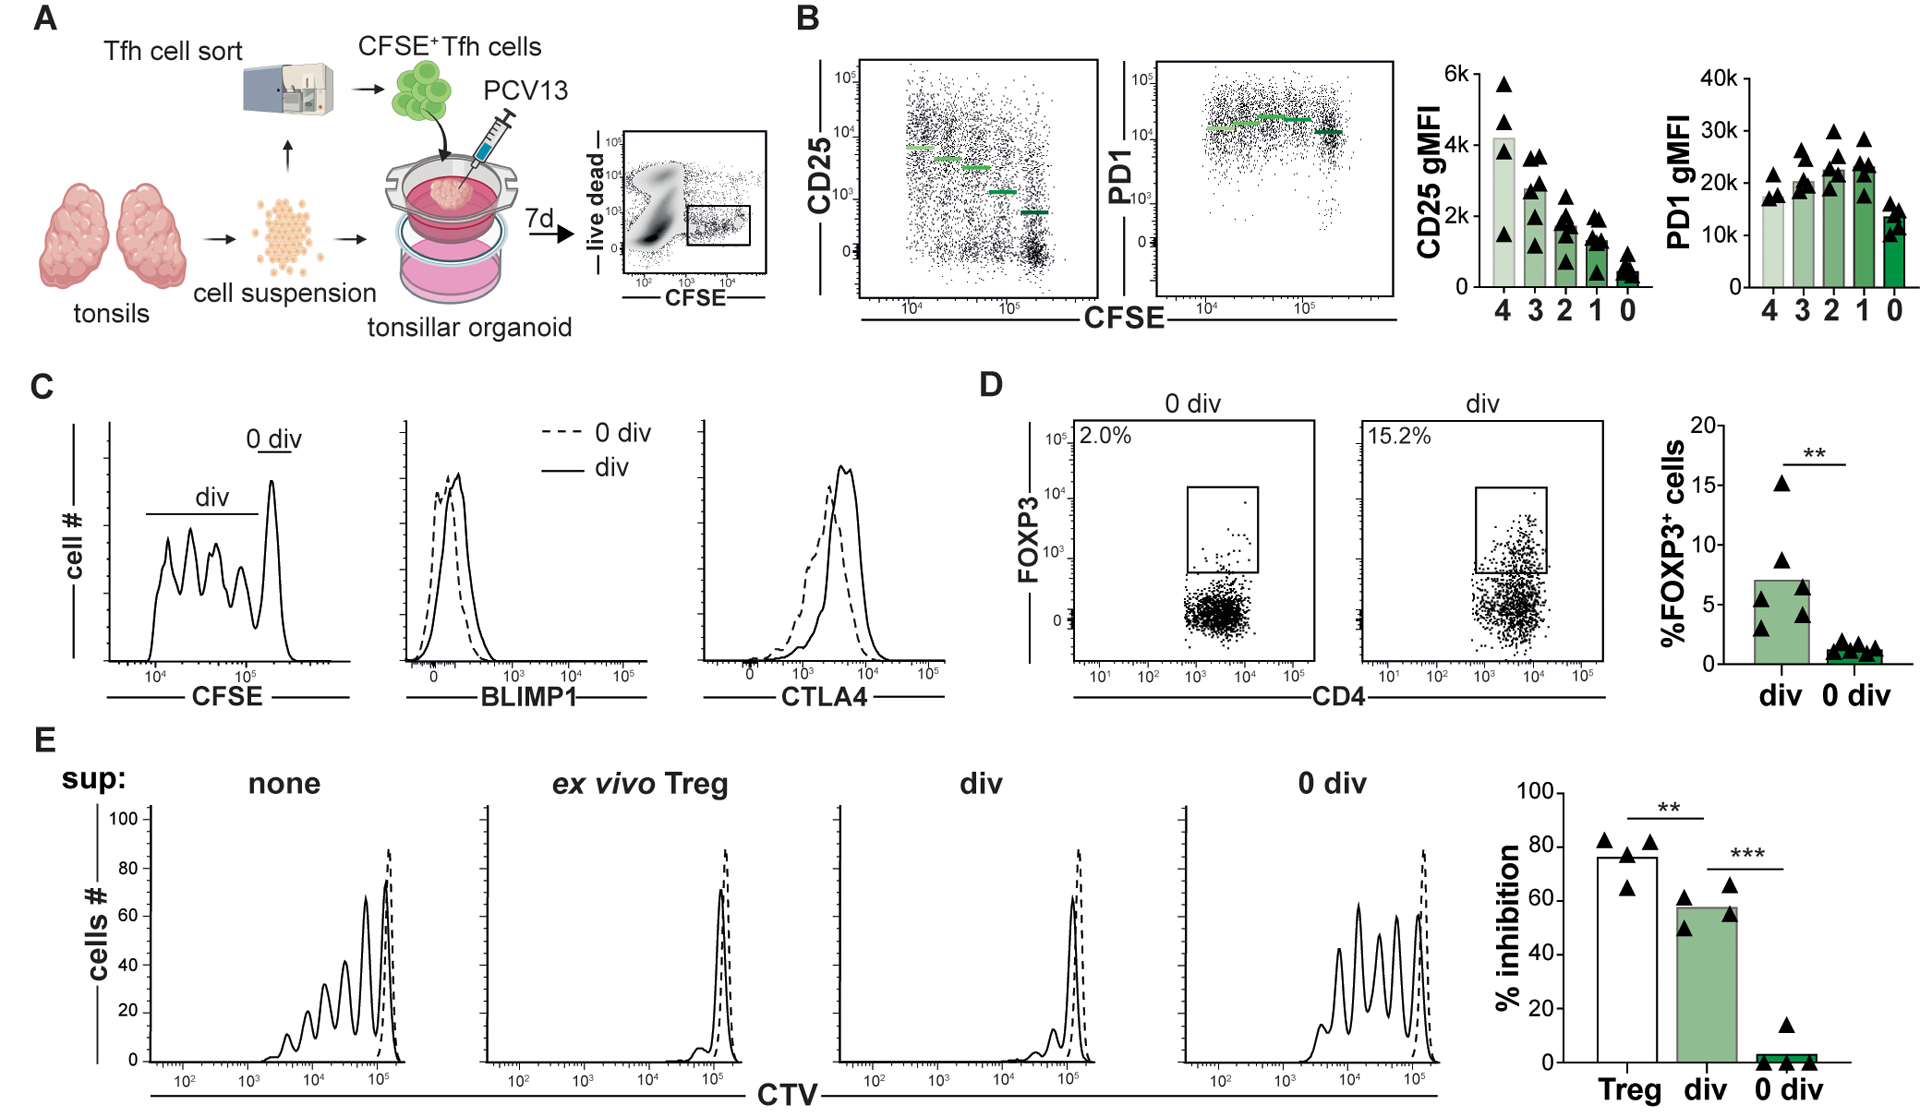
Figure 2. Tonsillar organoids model Tfh to Tfr cell development.

(A) A strategy to track Tfh to Tfr cell development within tonsillar organoids that are activated with pneumococcal conjugated vaccine 13 serotypes (PCV13) is depicted. (B) Day 7 CD25, PD1, (C) BLIMP1, CTLA4 and (D) FOXP3 expression by divided (div) and non-divided (0 div) Tfh cells are displayed. Green bards and horizontal lines indicate mean values (n=6) (E, left) Representative histograms show CTV-labeled T-cell responders (Tresp, CD45RO−CD25−CD4+ T cells) stimulated (solid line) or not (dashed line) in co-culture with either ex vivo Treg cells, or Tfh cells from day 7 organoids that were CD25+CFSEdim or CD25−CFSEbright. Bar graph (right) represents mean percent inhibition relative to unstimulated (n=5). **, P<0.01; ***, P<0.001 by Mann-Whitney U tests (D) and one-way ANOVA (E).
