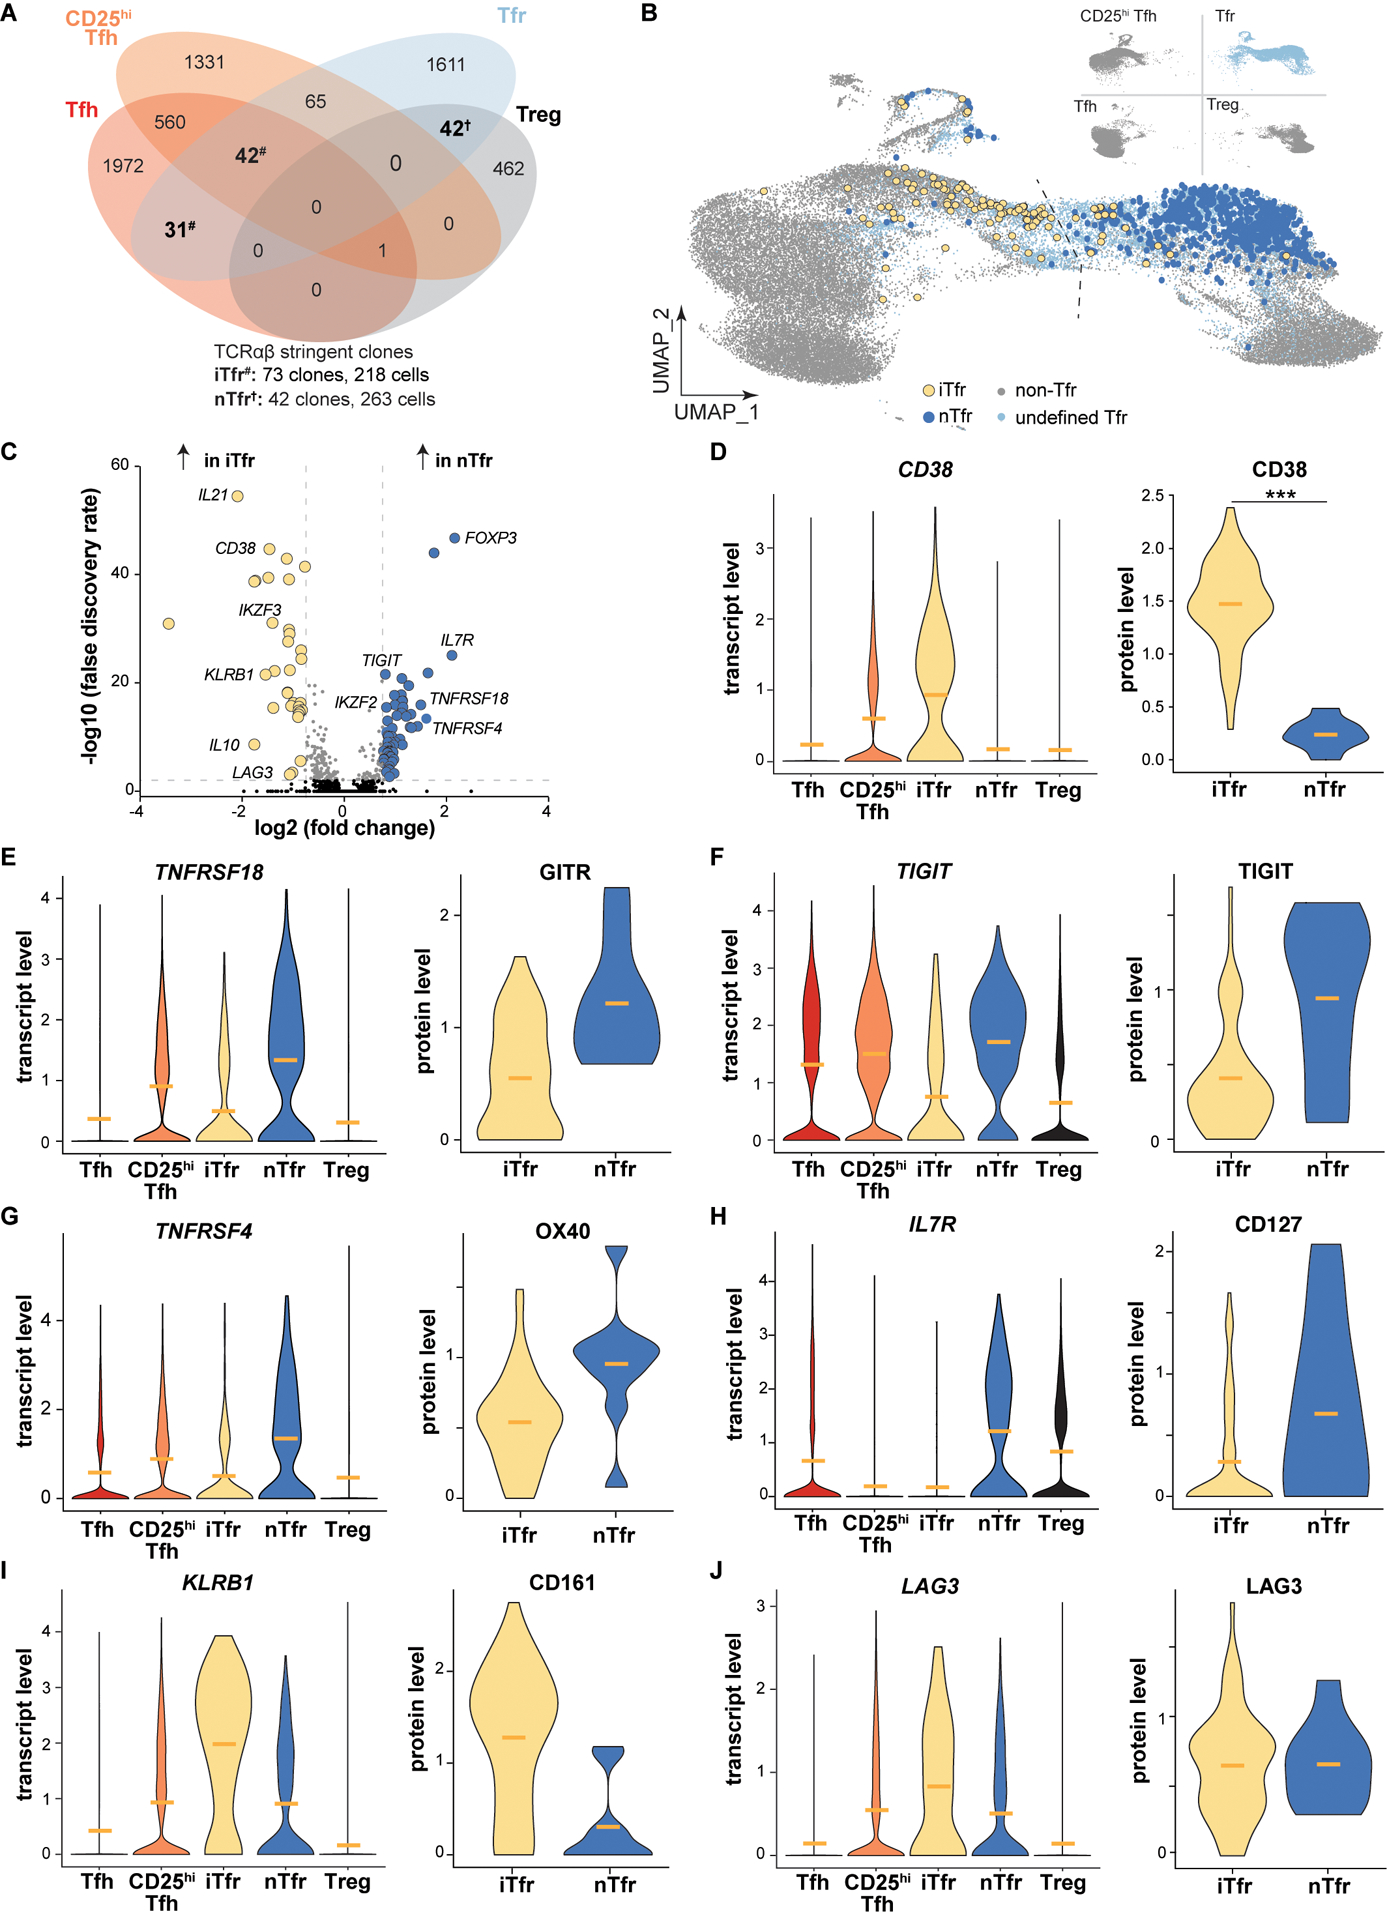
Figure 4. Transcriptomes of stringently defined iTfr and nTfr cells diverge, with cell type origin predicted by CD38/CD38 expression.

(A) Venn diagram displays overlapping TC174 stringent clones, defined as a clone with ≥2 cells. #, iTfr stringent clones; †, nTfr stringent clones. (B) Positions of stringent TC174 iTfr and nTr cells are displayed overlying a UMAP plot. (C) A volcano plot shows genes differentially expressed between stringently defined iTfr and nTfr cells pooled from TC174 and TC341. (D-J) Violin plots display differential expression of pooled transcripts and corresponding cell surface protein expression on TC341 subsets. Horizontal bars indicate mean values. ***, P<0.001 by Wilcoxon rank sum test with Bonferroni correction for protein expression comparisons.
