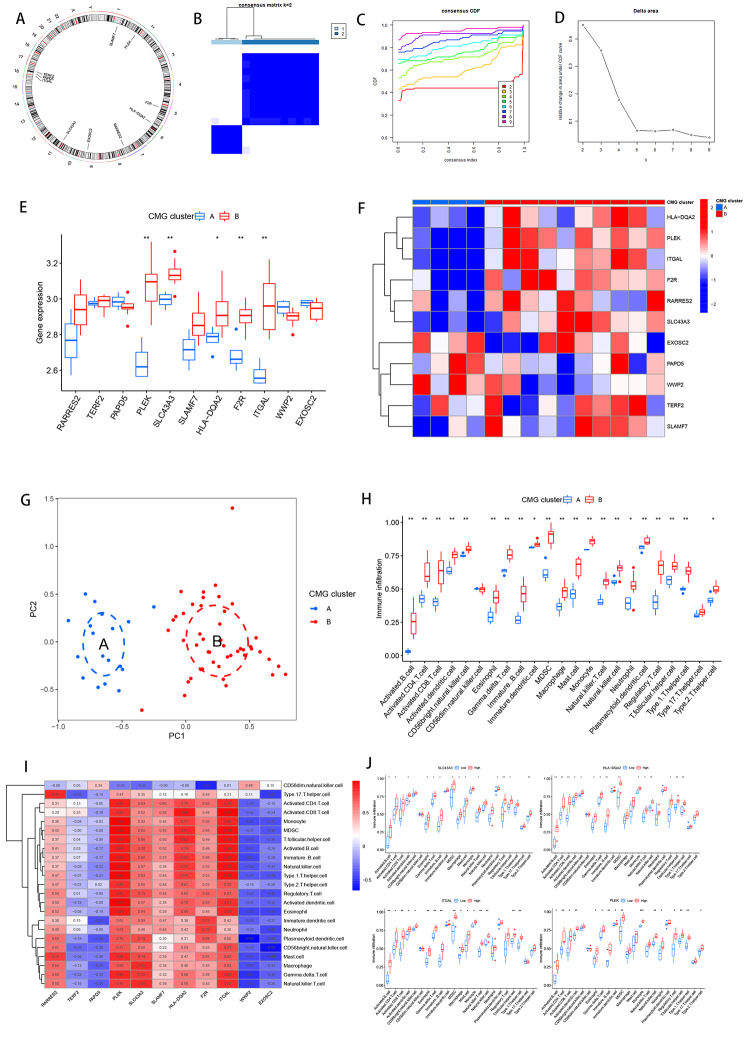
Fig. 5.
Consensus clustering identifies the molecular subtypes of marker genes. (A) Chromosomal circle diagram of 11 marker genes. (B) Consensus matrix for k = 2. (C) Consensus clustering CDF for k = 2 to 9. (D) Relative change in area under the cumulative CDF curve for k = 2 to 9. (E) Expression levels of marker genes in clusters A and B. (F) Heatmaps of marker gene expression. (G) PCA analysis. (H) Immune cell fraction between clusters A and B. (I) Correlation analysis of marker genes and immune cells. (J) Immune cell fraction of four marker genes between clusters A and B

