Fig. 8.
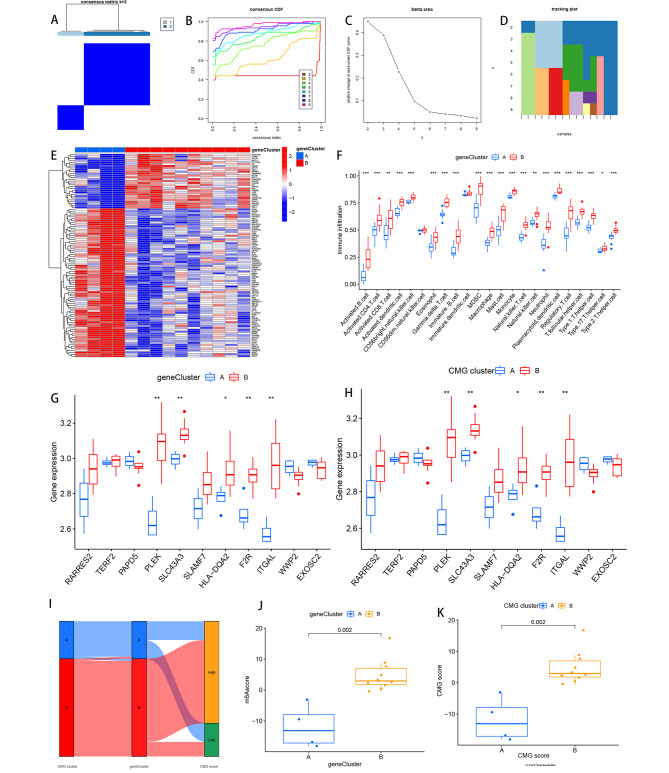
Consensus clustering identifies the molecular subtypes of intersecting genes. (A) Consensus matrix for k = 2. (B) Consensus clustering CDF for k = 2 to 9. (C) Relative change in area under the cumulative CDF curve for k = 2 to 9. (D) Tracking plot showing the number of consensus clusters for samples in each k. (E) Heatmaps of intersecting gene expression. (F) Immune cell fraction between cluster A and cluster B. (G) Immune cell fraction of tagged genes between gene clusters. (H) Immune cell fraction between CMGs clusters. (I) Sankey diagram of CMGs scores versus CMGs scores and gene scores. (J) Differences in CMGs scores by CMGs score type. (K) Differences in CMGs scores by gene score type

