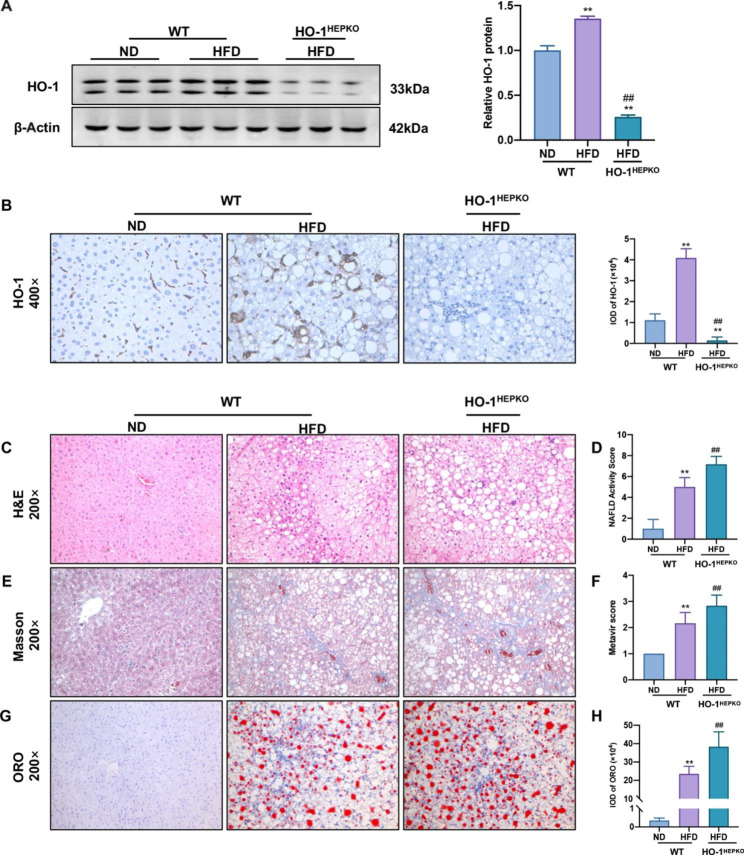
Fig. 1.
Hepatocyte conditional knockout of HO-1 aggravates HFD-induced NASH. (A) Western blot analysis of HO-1 in liver tissue. β-Actin served as the loading control. (B) Images of HO-1 (×400 magnification) staining of representative liver sections in WT and HO-1HEPKO mice. (C) Images of H&E (×200 magnification) staining of representative liver sections and (D) the NAFLD activity score. (E) Images of Masson (×200 magnification) staining of representative liver sections and (F) the Metavir score. (G, H) Images and IOD of Oil Red O (×200 magnification) staining of representative liver sections were obtained from each group. Values are the mean ± SD (n = 6 per group). *P < 0.05, **P < 0.01 compared to the WT ND group; #P < 0.05, ##P < 0.01 compared to the WT HFD group

