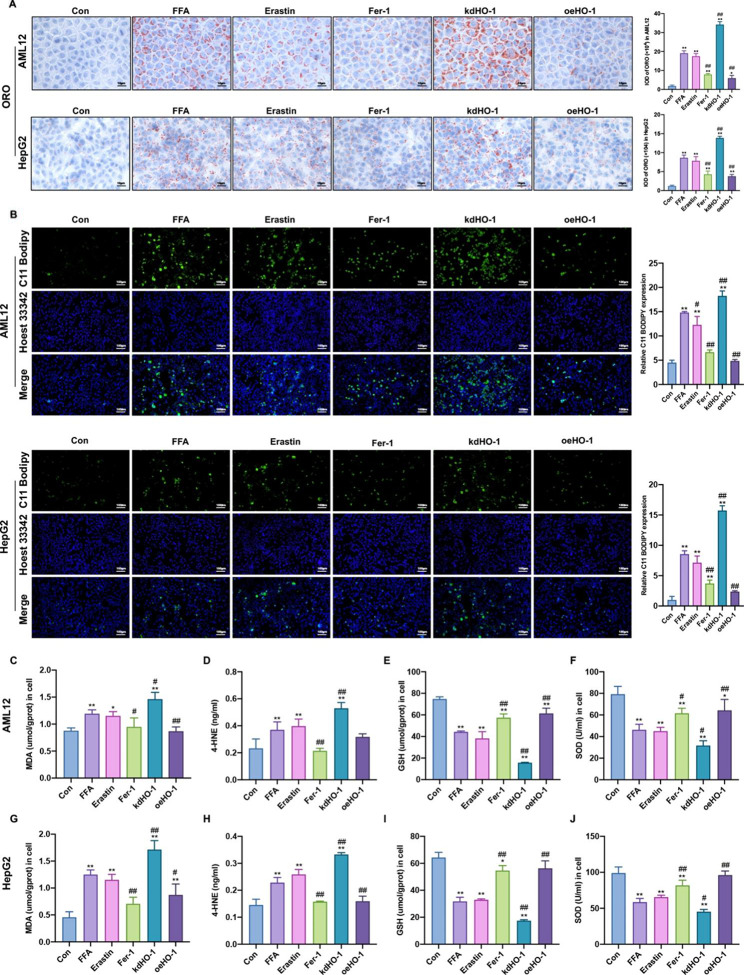
Fig. 4.
HO-1 reduced lipid droplet accumulation and hepatic lipid peroxidation in AML12 and HepG2 cells. (A) Representative images of Oil Red O analysis of lipids in AML12 and HepG2 cells (scale bar = 10 μm). (B) C11 BODIPY 581/591 staining in AML12 and HepG2 cells (green). Nuclei were stained using Hoechst 33,342 (blue) (scale bar = 100 μm). The levels of (C, G) MDA, (D, H) 4-HNE, (E, I) GSH, and (F, J) SOD in AML12 and HepG2 cells. Values are the mean ± SD. *P < 0.05, **P < 0.01 compared with the control group; #P < 0.05, ##P < 0.01 compared with the FFA group

