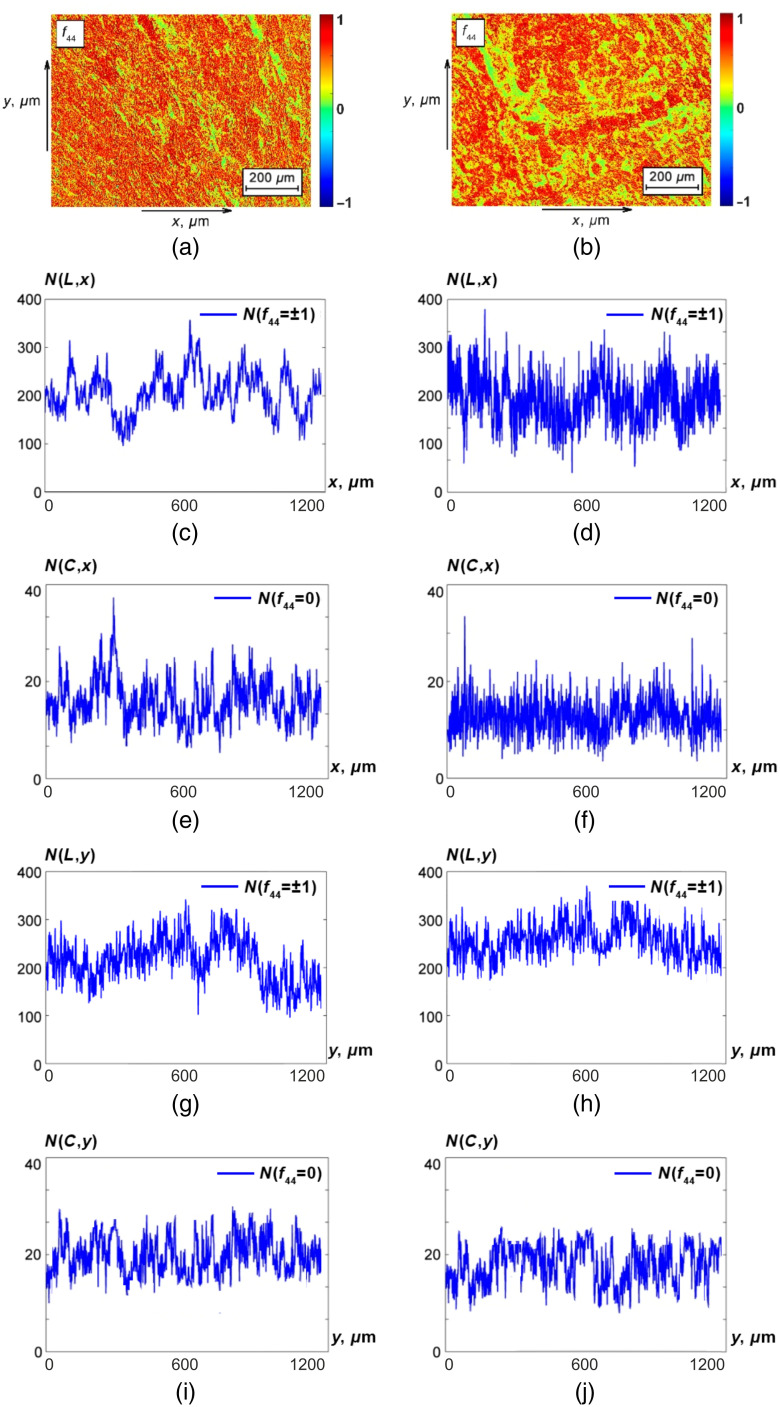
Fig. 2.
Spatial distributions of characteristic values of the MM images of histological sections of prostate adenoma (a) and carcinoma (b). Illustrative linear dependences of , , , and , respectively, for prostate adenoma (c), (e), (g), (i) and carcinoma (d), (f), (h), (j). See further details in the text.

