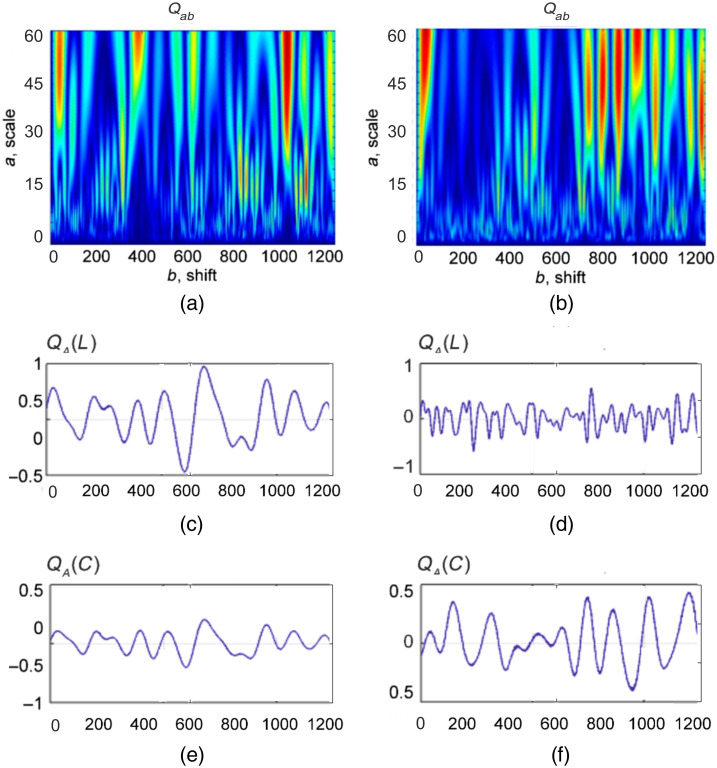
Fig. 5.
Wavelet transform of distributions and for (a) adenoma and (b) carcinoma tissues. Linear dependencies of the amplitudes of the wavelet coefficients and on the optimal scale of the MHAT function of MM image characteristic values for (c), (e) myoma and (d), (f) endometriosis tissues, respectively.

