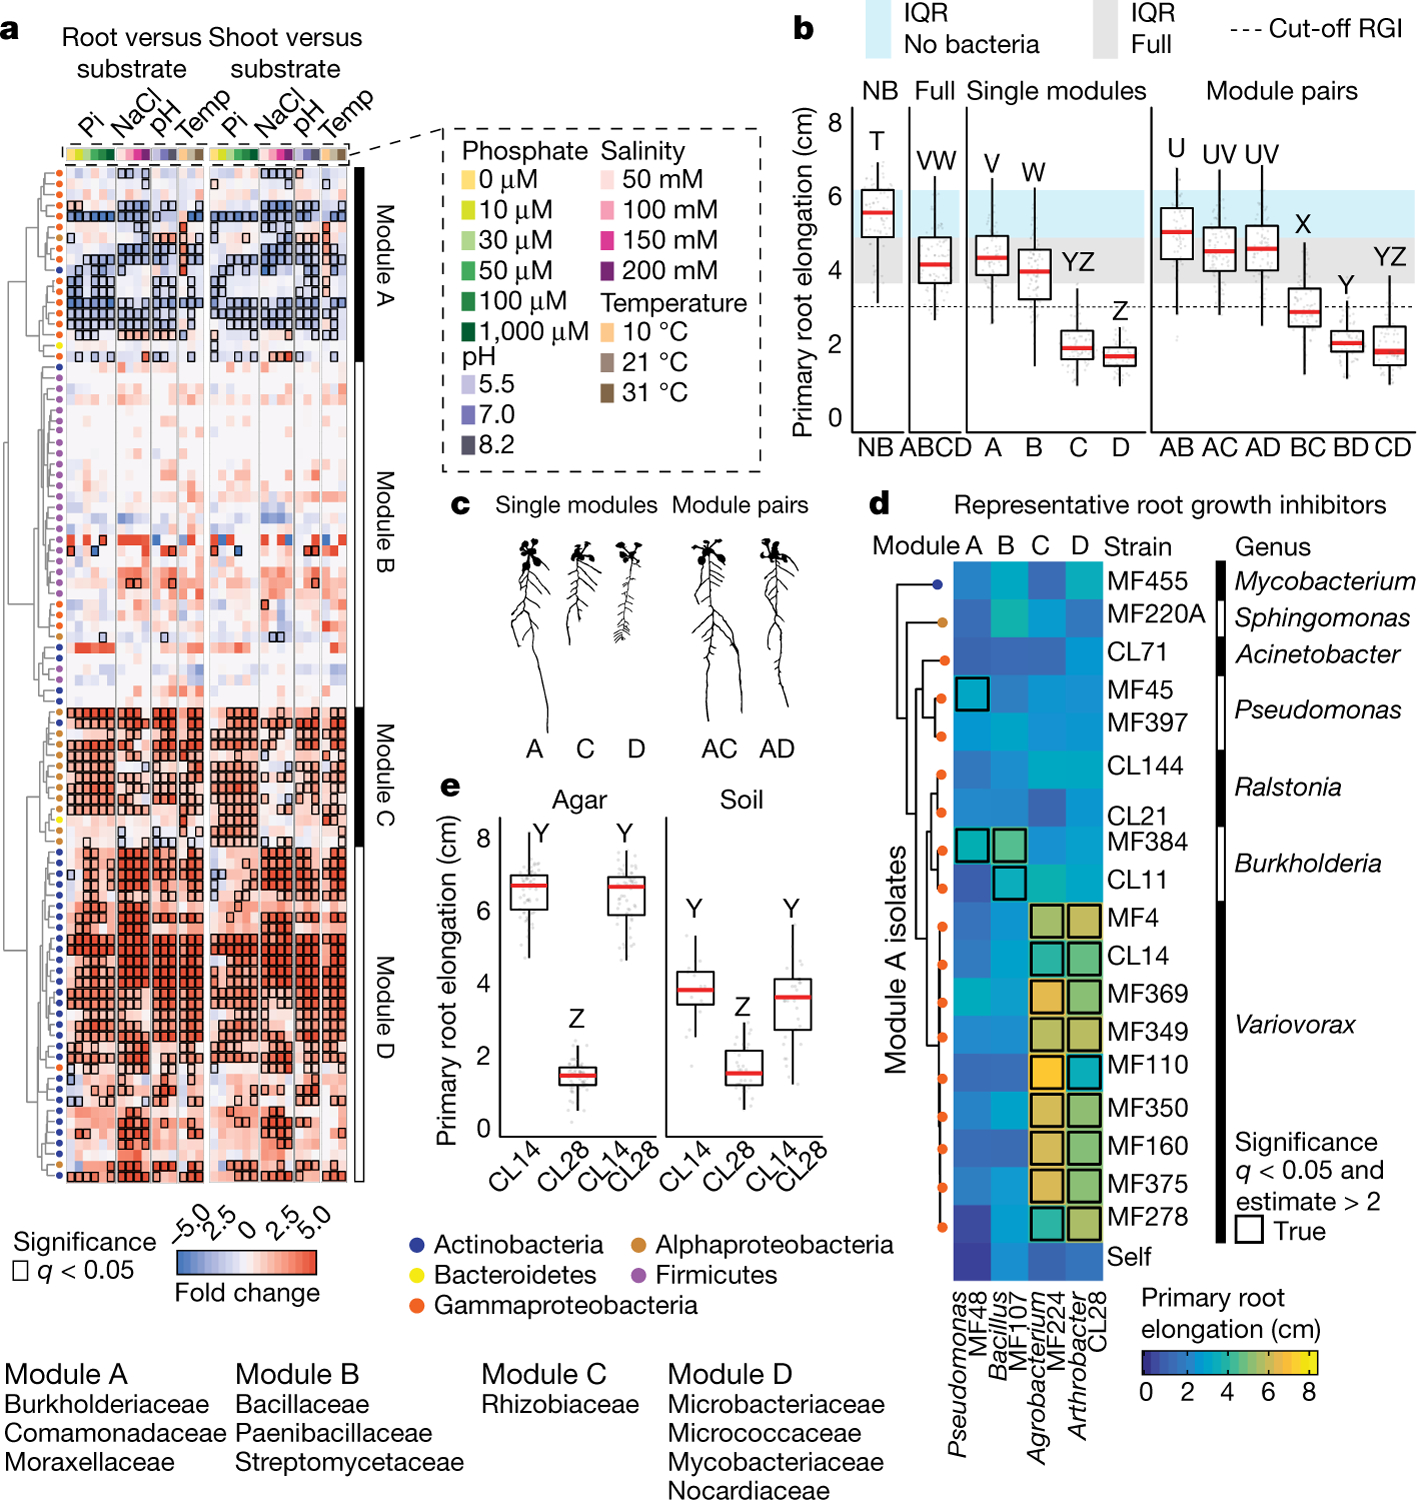
Fig. 1 |. Arabidopsis root length is governed by bacteria–bacteria interactions within a community.

a, Fraction enrichment patterns of the synthetic community across abiotic gradients. Each row represents a unique sequence. The four modules of co-occurring strains (A, B, C and D) are represented. Dendrogram tips are coloured by taxonomy. Heat maps are coloured by log2-transformed fold changes derived from a fitted generalized linear model and represent enrichments in plant tissue (root or shoot) compared with substrate. Comparisons with false-discovery-rate (FDR)-corrected q-value < 0.05 are contoured in black. Enriched families within each module are listed below the heat map. n = 6 biological replicates across 2 independent experiments. Pi, inorganic phosphate; temp, temperature. b, Primary root elongation of seedlings grown axenically (no bacteria, NB), with the full synthetic community (ABCD) or its subsets: modules A, B, C and D alone (single modules), and all pairwise combination of modules (module pairs). Significance was determined via analysis of variance (ANOVA); letters correspond to a Tukey post hoc test. n = 75, 89, 68, 94, 87, 77, 76, 96, 82, 84, 89 and 77 (from left to right) biological replicates across 2 independent experiments. c, Binarized image of representative seedlings inoculated with modules A, C and D, and with module combinations A–C and A–D. d, Heat map coloured by average primary root elongation of seedlings inoculated with four representative RGI-inducing strains from each module (columns A–D) in combination with isolates from module A (rows) or alone (self). Significance was determined via ANOVA. e, Primary root elongation of seedlings inoculated with Arthrobacter CL28 and Variovorax CL14 individually or jointly across two substrates. Significance was determined via ANOVA, letters are the results of a Tukey post hoc test. n = 64, 64, 63, 17, 36 and 33 (from left to right) biological replicates across 2 independent experiments. In all box plots, the centre line represents the median, box edges show the 25th and 75th percentiles, and whiskers extend to 1.5× the interquartile range (IQR).
