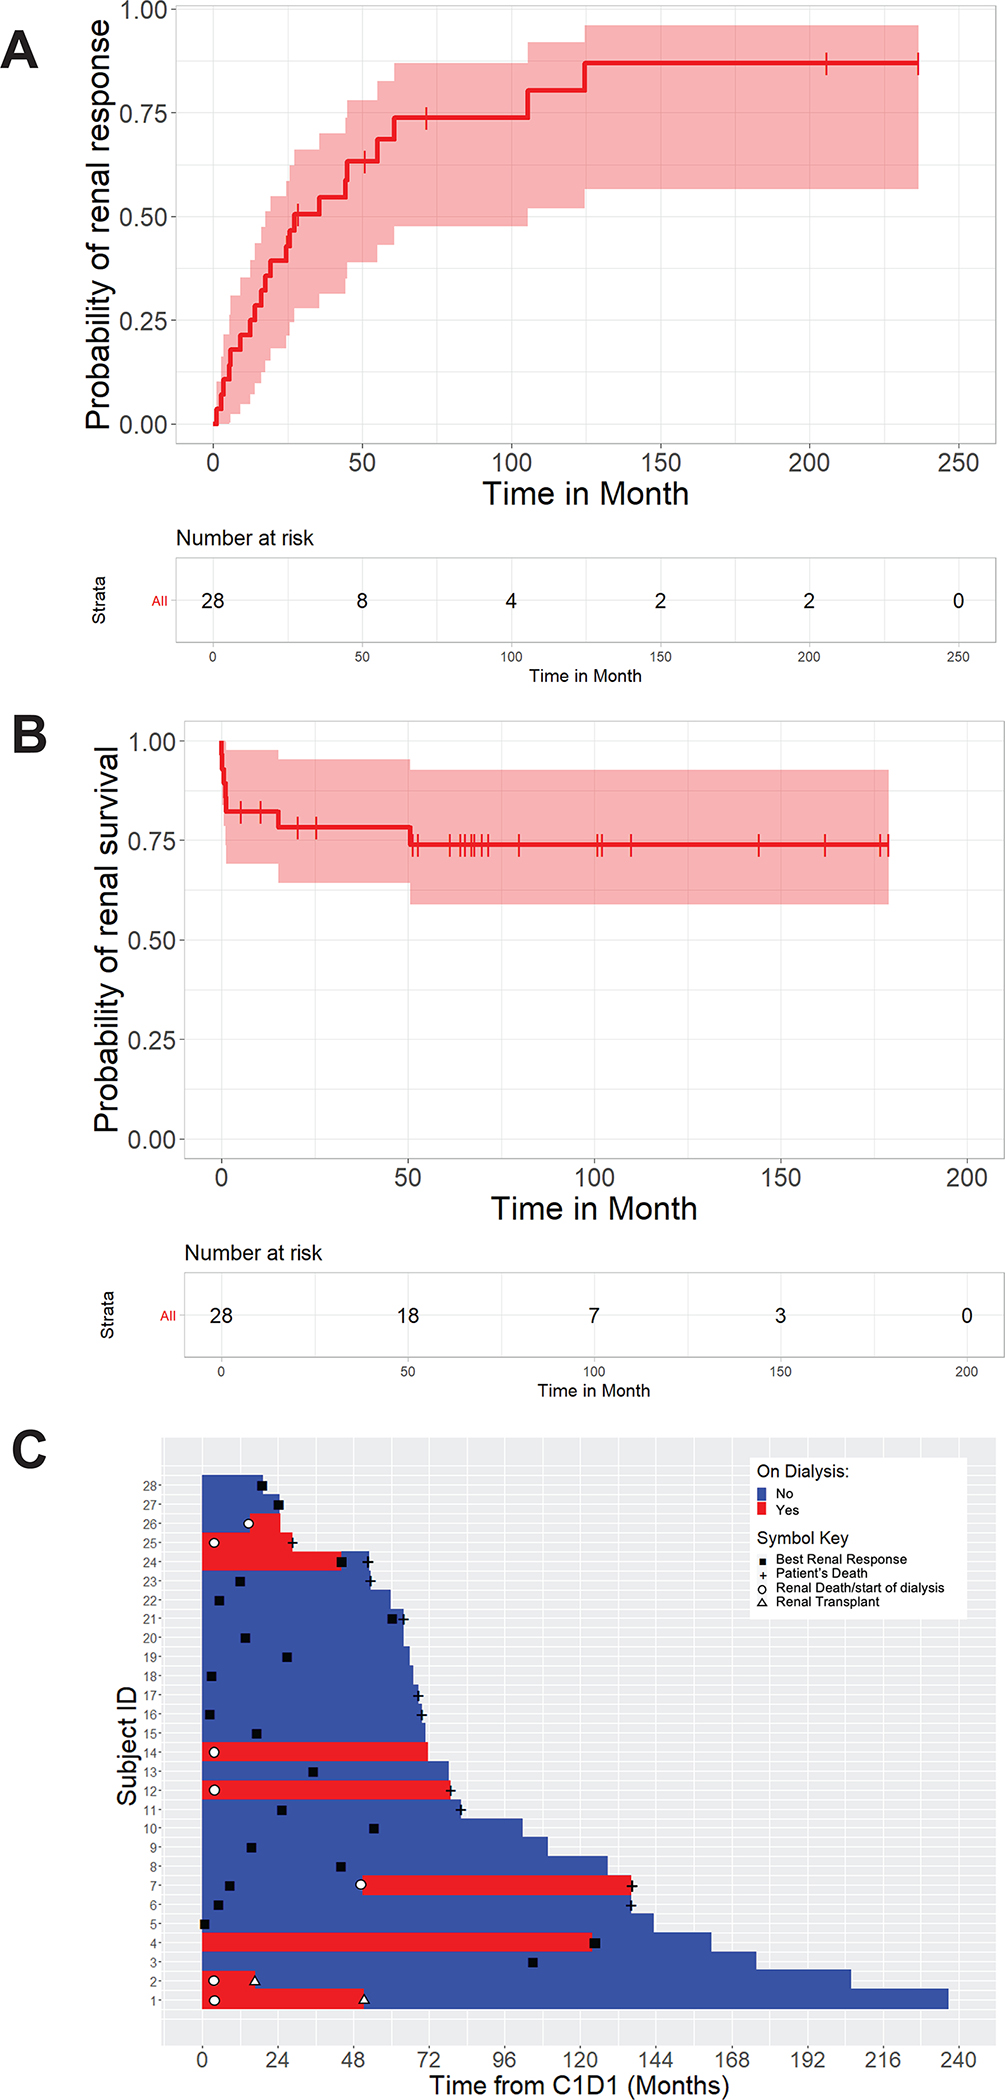
Figure 1:

Renal response. (A) Time to best response from start of therapy. (B) Duration of response from start of therapy. (C) Swimmer plot illustrating, for each patient, time to best renal response, time to renal death, and time to last assessment or patient’s death.
