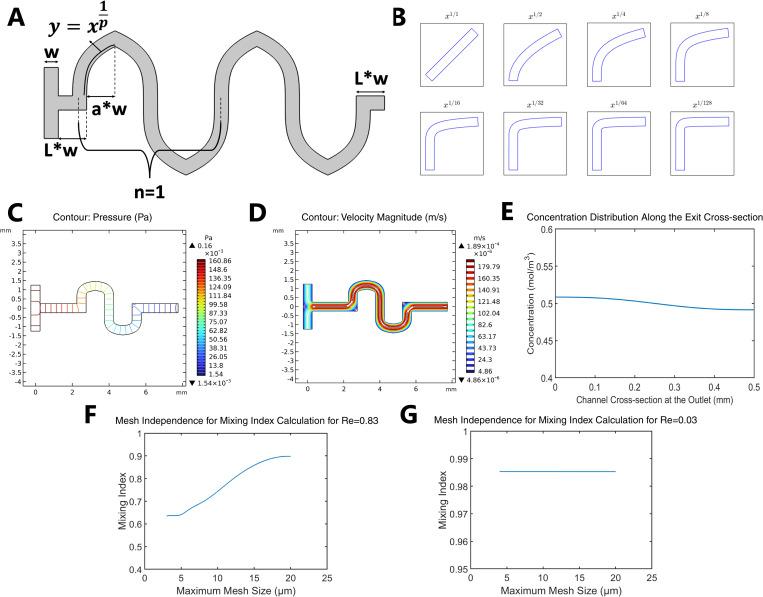
FIG. 2.
Simulation procedure. (a) Demonstration of the microchannel geometry with changeable parameters. (b) Depiction of the micromixer profiles. (c) Pressure contour plot. (d) Velocity streamline plot. (e) Concentration distribution along the vertical cross section for the case of p = 16, a = 1, L = 5, n = 1, Q = 1 μL min−1, and w = 500 μm. 0–1 on the x axis corresponds to the top-bottom line at the outlet cross section. (f) Mesh independence study for Re = 0.83, p = 16, a = 5, L = 5, n = 3, w = 200 μm, and Q = 10 μL min−1 case. (g) Mesh independence study for Re = 0.033, p = 16, a = 5, L = 5, n = 1, w = 500 μm, and Q = 1 μL min−1 case.

