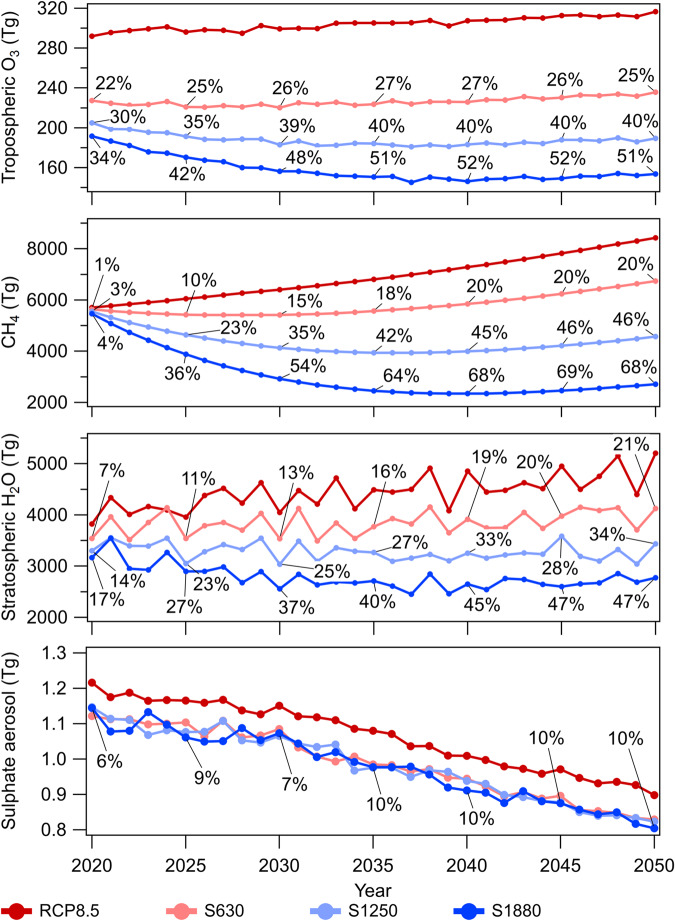
Fig. 3. Global burdens of short-lived climate forcers from 2020 to 2050 in different scenarios (red, RCP8.5; pink: S630; light blue: S1250; dark blue: S1880).
Top to bottom panels—tropospheric O3, CH4, Stratospheric H2O, and sulfate aerosol. The percentage reduction compared to RCP8.5 is shown as numbers on each plot. The global burdens of all SLCFs are lower compared to RCP8.5. The percentage change stabilizes after 2035 for all SLCFs in all the cases.

