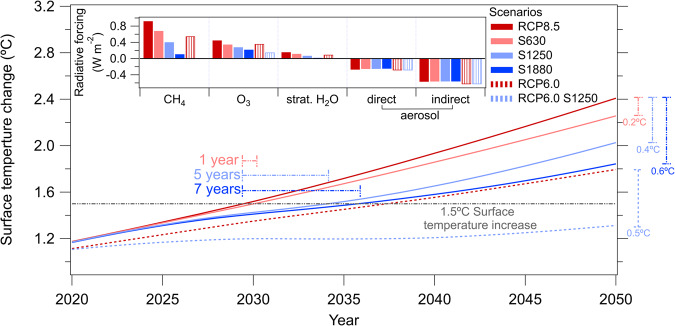
Fig. 4. Surface temperature change from 2020 to 2050 for the RCP8.5, S630, S1250, and S1880 (solid lines) and RCP6.0 and RCP6.0 S1250 (dashed lines) scenarios.
The 1.5 °C target is marked by the horizontal gray dash-dotted line. The “gained” time to cross the 1.5 °C target compared to RCP8.5 is shown in the colored horizontal dash-dotted lines for each scenario. The 2050 temperature decreases for each scenario compared to RCP8.5 is shown in the colored vertical dash-dotted lines on the right-hand side. The S1250 scenario adds 5 years before reaching the 1.5 °C target compared to the RCP8.5 scenario. The S1250 scenario results in a reduction of 0.4 °C in 2050 from the surface temperature given in RCP8.5. Additional emissions of 1250 Tg Cl/year to RCP6.0 will postpone crossing the 1.5 °C target until after 2050. The inset shows the radiative forcing in 2050 w.r.t 1850 of the five main SLCFs that are impacted by the added molecular chlorine emissions. Radiative forcing of CH4 decreases by almost 90% from RCP8.5 to the S1880 scenario. O3 and stratospheric H2O are both affected by the increase in additional molecular chlorine flux and their radiative forcing decrease as a result. The impact of changes in atmospheric aerosols is small.

