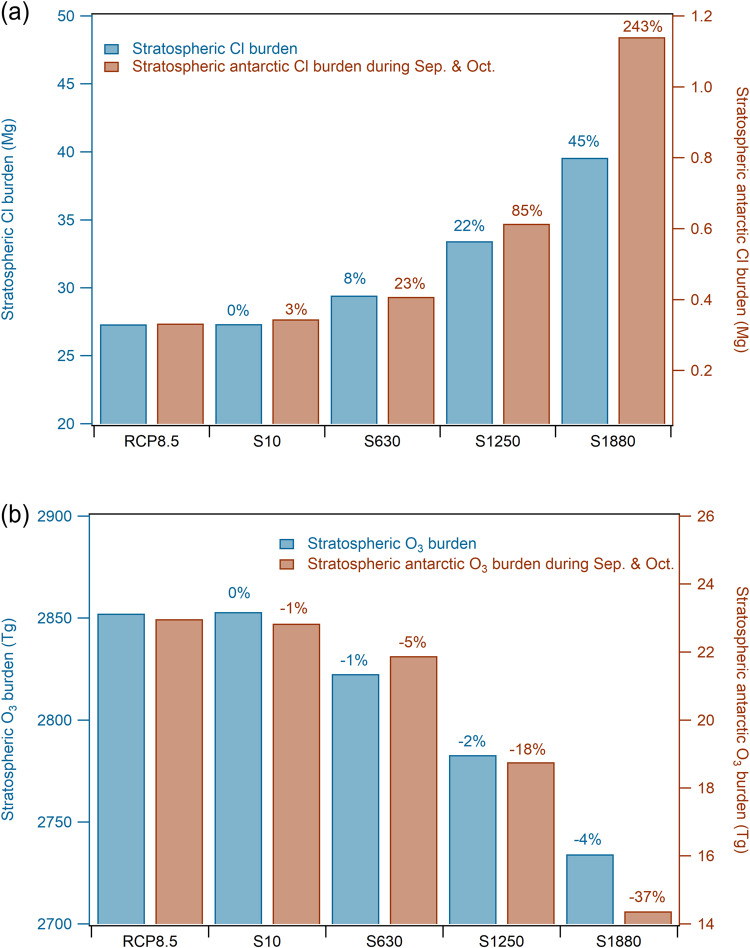
Fig. 5. Stratospheric chlorine and O3 burden average from 2020 to 2050 in RCP8.5, S10, S630, S1250, and S1880 scenarios.
a Cl burden in the global stratosphere and that in the Antarctic stratosphere (90°S to 70°S; 70 hPa to 200 hPa) during September and October. b O3 burden in the global stratosphere and that in the Antarctic stratosphere (90°S to 70°S; 70 hPa to 200 hPa) during September and October. The numbers on top of the sensitivity scenarios bars indicate the changes of chlorine/O3 in these scenarios compared to that in RCP8.5 case. Note that both Y-axes in both panels start at values larger than zero.

