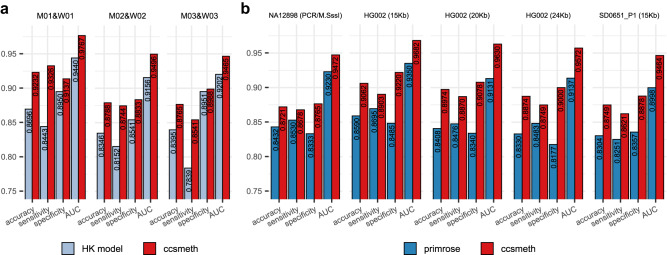
Fig. 2. Evaluation of ccsmeth on 5mCpG detection at read level.
a Comparing ccsmeth and HK model on three datasets of PCR-treated and M.SssI-treated human DNA. b Comparing ccsmeth and primrose on NA12898 (10 Kb, PCR/M.SssI-treated), HG002 (15 Kb, 20 Kb, 24 Kb), and SD0651_P1 (15 Kb) CCS reads. Values in the figure are the average of 5 repeated tests. AUC area under the curve. The standard deviation values of the multiple repeated tests are in Supplementary Table 4. Source data are provided as a Source Data file.

