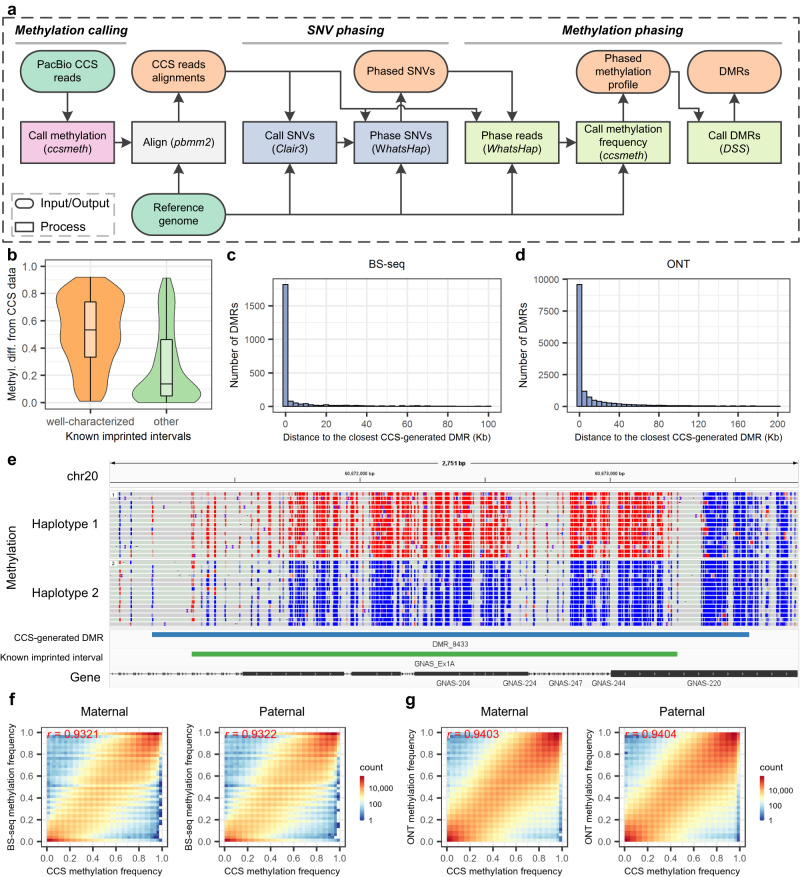
Fig. 4. Methylation phasing of ccsmethphase using the HG002 CCS data.
a Pipeline of ccsmethphase for calling haplotype-aware methylation using CCS data. b Distribution of methylation differences of known imprinted intervals calculated using CCS data between two haplotypes of HG002. 96 out of 102 “well-characterized” intervals, and 95 out of 102 “other” intervals which have at least 5 CpGs covered by CCS reads in each haplotype are analyzed. The boxes inside the violin plots indicate 50th percentile (middle line), 25th and 75th percentile (box), the smallest value within 1.5 times interquatile range below 25th percentile and largest value within 1.5 times interquatile range above 75th percentile (whiskers). c, d Distribution of the number of BS-seq-generated and ONT-generated DMRs in terms of distance to the closest CCS-generated DMR. e Screenshot of Integrative Genomics Viewer (chr20:60,671,001-60,673,750) on a DMR of HG002 near the maternally imprinted gene GNAS. Red and blue dots represent CpGs with high and low methylation probabilities, respectively. f, g Comparing of PacBio CCS with BS-seq and nanopore sequencing on site-level methylation frequencies of maternal and paternal haplotypes phased by Illumina trio data. Methyl. diff. methylation difference, r: Pearson correlation, ONT nanopore sequencing. Source data underlying b, c, and d are provided as a Source Data file.

