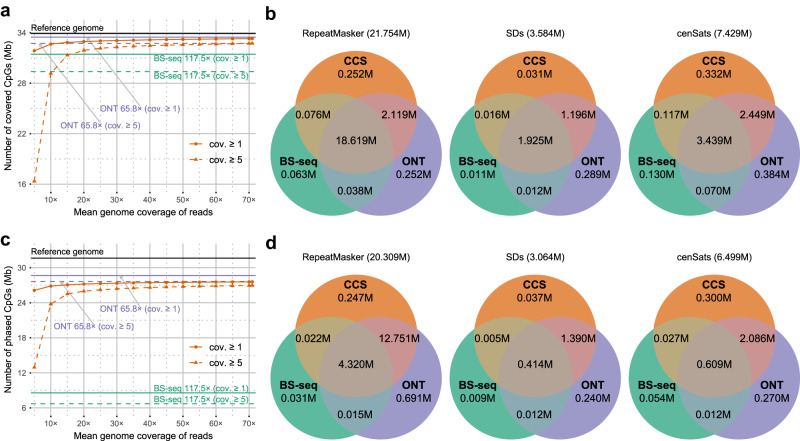
Fig. 5. Comparison of the number of CpGs detected/phased by using CCS/BS-seq/nanopore sequencing in the human genome.
a The number of CpGs in autosomes and sex chromosomes detected by using difference coverage of HG002 CCS reads. Values for 5×–70× are the average of 5 repeated tests. b Comparison of the number of CpGs detected by the total HG002 BS-seq (117.5×), ONT (65.8×), and CCS (71.0×) reads in repeats annotated by RepeatMasker, segmental duplications, and peri/centromeric regions of autosomes and sex chromosomes. CpGs covered by at least 5 reads are analyzed. c The number of CpGs in autosomes phased by using difference coverage of HG002 CCS reads. Values for 5×-70× are the average of 5 repeated tests. d Comparison of the number of CpGs phased by using the total HG002 BS-seq (117.5×), ONT (65.8×), and CCS (71.0×) reads in repeats annotated by RepeatMasker, segmental duplications, and peri/centromeric regions of autosomes. CpGs covered by at least 5 phased reads are analyzed. The standard deviation values of the multiple repeated tests of figures a and c are in Supplementary Tables 14–15. Values in the titles of Venn graphs in sub-figures b and d are the total number of CpGs in corresponding regions of the T2T-CHM13 genome. cov. coverage, SDs segmental duplications, cenSats peri/centromeric satellites. Source data underlying a and c are provided as a Source Data file.

