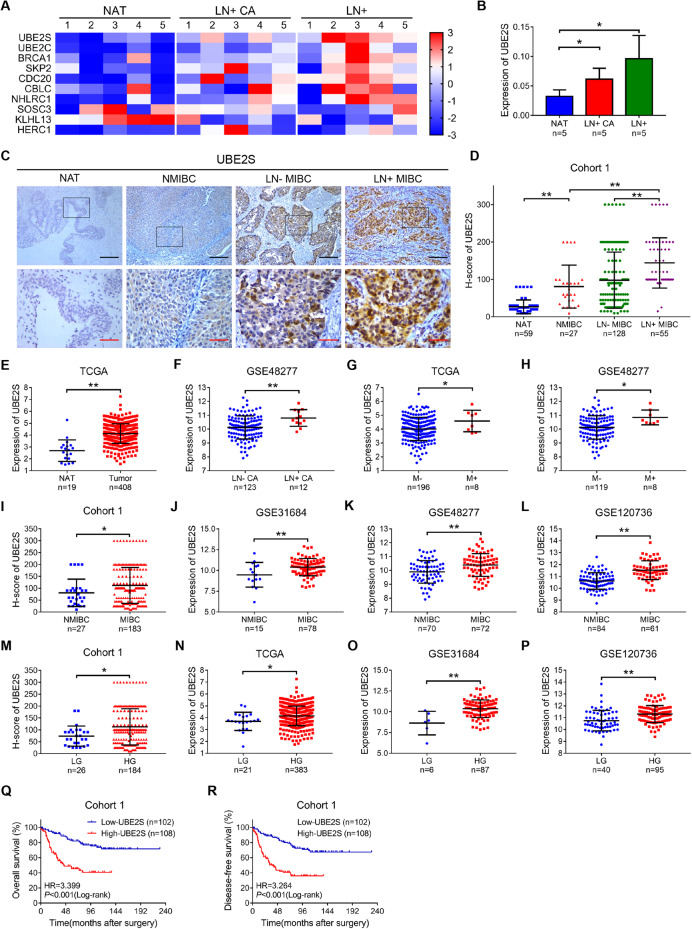
Fig. 1. UBE2S positively correlates with lymphatic metastasis and poor prognosis in bladder cancer (BCa).
A Heatmap of 10 dysregulated expressed ubiquitination-related genes in NAT, LN+ CA and LN+, as detected by qPCR. NAT, normal adjacent tissues; LN+ CA, BCa tissues with lymphatic metastasis; LN+, metastatic LNs. B Histogram showing the analysis of UBE2S mRNA expression in 5 paired BCa tissues detected by qPCR. C Representative images of immunohistochemistry staining for UBE2S expression in Cohort 1, which consisted of 59 NAT and 210 BCa tissues. Scale bars: black, 200 μm; red, 50 μm. D Protein levels of UBE2S in Cohort 1. E The relative mRNA expression of UBE2S in NAT and BCa tissues from the TCGA database. F Expression of UBE2S in LN− CA and LN + CA in the GSE48277 database. LN- CA, BCa tissues without lymphatic metastasis. G, H Comparison of UBE2S expression in BCa tissues without metastasis (M−) and with metastasis (M+) from TCGA and GSE48277 databases. I–L Comparison of UBE2S expression in NMIBC and MIBC tissues from Cohort 1, GSE31684, GSE48277 and GSE120736 databases. NMIBC nonmuscle-invasive bladder cancer, MIBC muscle-invasive bladder cancer. M–P Comparison of UBE2S expression in LG and HG BCa tissues from Cohort 1, TCGA, GSE31684 and GSE120736 databases. LG low-grade, HG high-grade. Q, R Kaplan‒Meier curves showing the overall survival (OS) and disease-free survival (DFS) of BCa patients with high UBE2S expression and low UBE2S expression in Cohort 1). *P < 0.05 and **P < 0.01.

