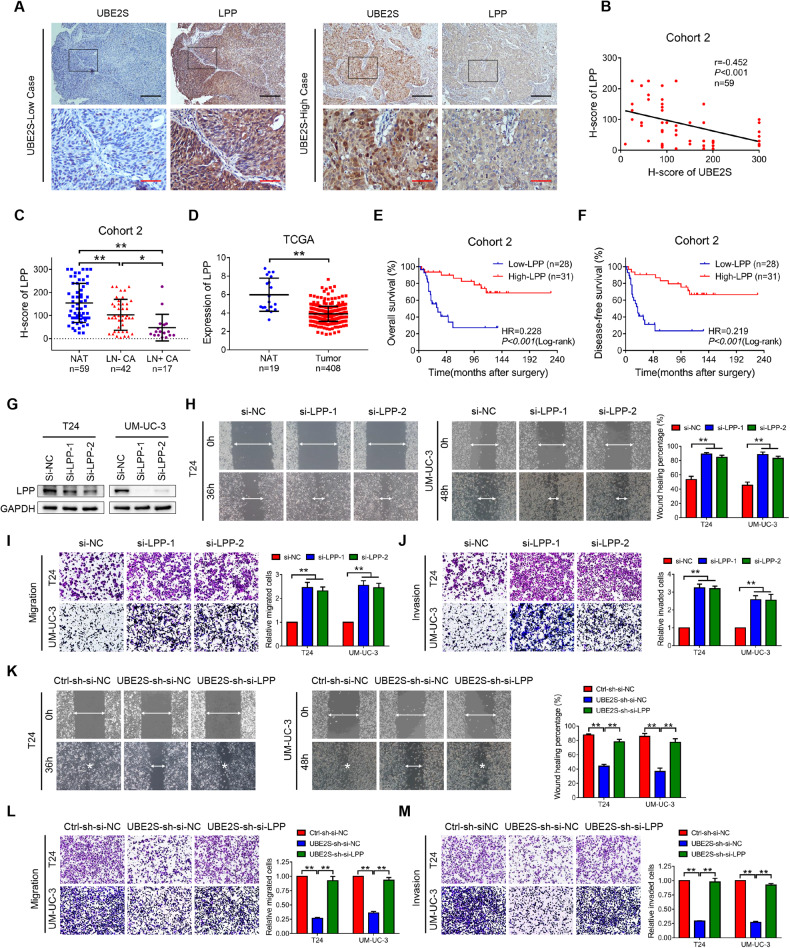
Fig. 5. LPP reverses the metastasis-promoting effects of UBE2S.
A Representative images of UBE2S and LPP immunohistochemistry staining in BCa tissues. Scale bars: black, 200 μm; red, 50 μm. B Pearson’s correlation analysis of UBE2S and LPP protein expression in Cohort 2, which consisted of 59 paired BCa tissues. C LPP protein levels in Cohort 2. NAT normal adjacent tissues; LN− CA, BCa tissues without lymphatic metastasis; LN+ CA, BCa tissues with lymphatic metastasis. D Relative LPP mRNA expression in NAT and BCa tissues from the TCGA database. Kaplan‒Meier curves showing the overall survival (E) and disease-free survival (F) of BCa patients with high LPP expression and low LPP expression in cohort 2. G LPP protein levels in LPP-silenced BCa cells, as detected by western blot assays. Representative images and quantitative analysis of wound healing (H), transwell migration (I) and invasion (J) assays using LPP-silenced BCa cells. Representative images and quantitative analyses of wound healing (K), transwell migration (L) and invasion (M) assays of UBE2S-silenced BCa cells combined with LPP knockdown. *P < 0.05 and **P < 0.01.

