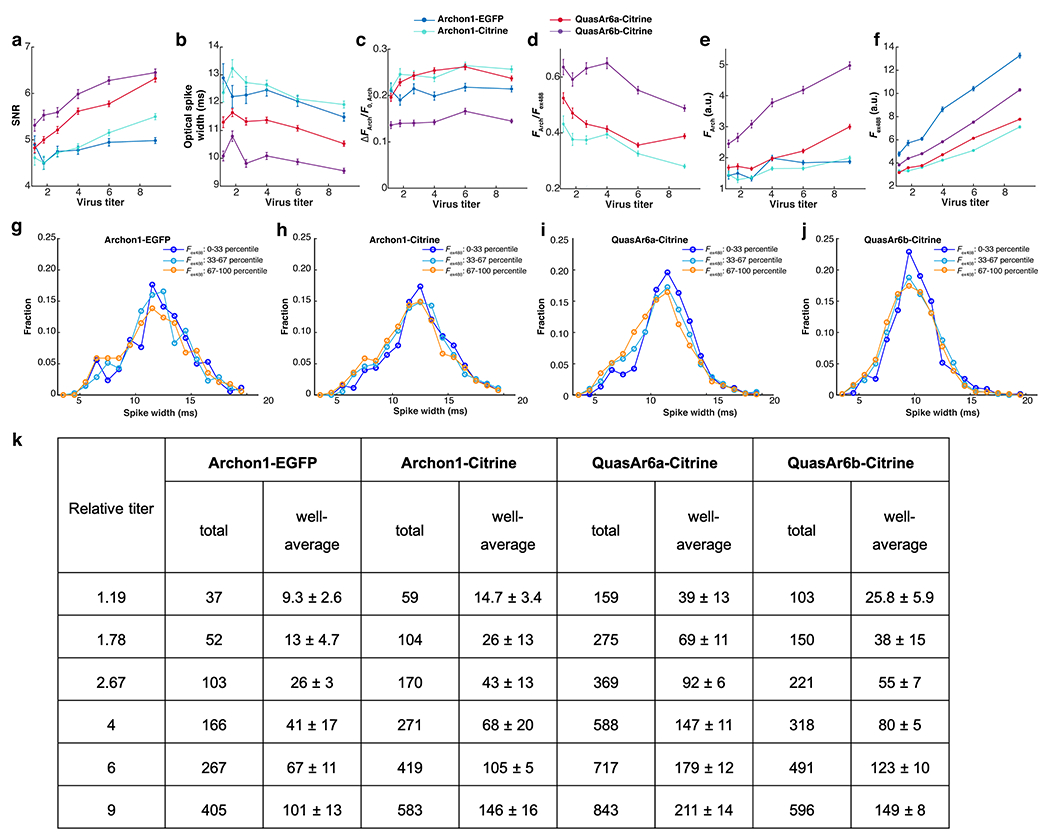
Extended Data Fig. 5. Metrics of GEVI performance in high-throughput Optopatch assay in cultured neurons (Related to Fig. 3).

a. SNR: spike height divided by the root mean square (RMS) baseline noise. b. Optical spike width: full width measured at 80% below the action potential peak. Note offset vertical axis. c. ΔFArch/F0, Arch: voltage sensitivity as a ratio of the increase in fluorescence during a spike to the baseline fluorescence. d. FArch/Fex488: per-molecule brightness as a ratio of baseline fluorescence in the Arch channel to the baseline fluorescence in the Citrine channel. The data for Archon1-EGFP were omitted because EGFP and Citrine fluorescence are not directly comparable. e. F0, Arch: baseline fluorescence in the Arch channel (exc: 635 nm). f. Fex488: baseline fluorescence in the Citrine channel (exc: 488 nm). In all measurements, the relative titers (from low to high) were: 1.19, 1.78, 2.67, 4, 6, 9. Each data point represents the average from 4 wells. The intensive properties (b, c, d) are largely insensitive to virus titer while the extensive properties (a, e, f) scale with virus titer. Error bars: SEM. g-j. Distribution of spike widths for neurons with low (0-33 percentile), medium (33-67 percentile) and high (67-100 percentile) expression level (Fex488). The distributions were similar across expression levels, for all GEVIs. k. Cell counts in high-throughput Optopatch assay. The total and well-average (mean ± S.D.) number of optically detected spiking cells, for each combination of GEVI construct and virus titer. At the higher titers, the well-to-well variations in detected cells within a given condition were ~10%, much smaller than the 200 - 300% differences between GEVI variants.
