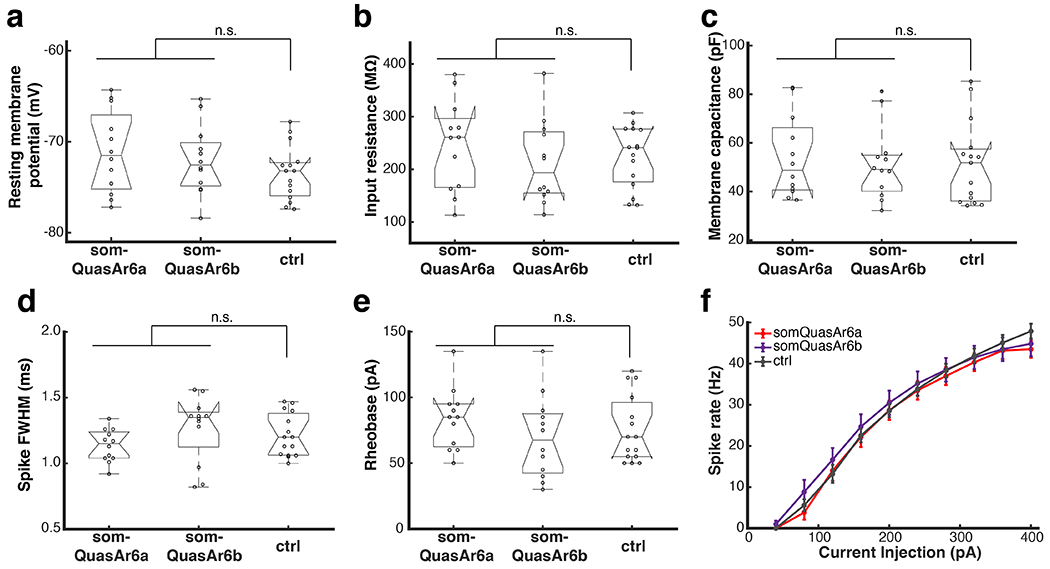
Extended Data Fig. 7. Effect of GEVI expression on membrane electrical properties and excitabilities (Related to Fig. 3).

Mouse L2/3 cortical neurons expressing Arch-based GEVIs were measured by patch clamp in acute slices (somQuasAr6a, n = 2 animals, 12 cells; somQuasAr6b, n = 2 animals, 12 cells). Non-expressing cells from the same slices were used as the control (n = 4 animals, 15 cells). Box plots: central mark indicates median, bottom edge 25th percentile, top edge 75th percentile, whiskers most extreme data points excluding outliers, ‘+’ symbol outliers. n.s., not significant, two-sided Wilcoxon rank-sum test. Error bars in g: SEM.
